How Much to Purge?
A modeling approach to purge volume guesstimation
A novel approach to determine an optimum groundwater purging and sampling strategy was published last year in the Journal of Hydrology
(Qi et al, 2017).
This paper uses a numerical model to estimate the “representativeness” of the groundwater sample at different purge times. The model was tested against field data from two validation wells – one using “three well volume” purging and the other using “low flow” purging.
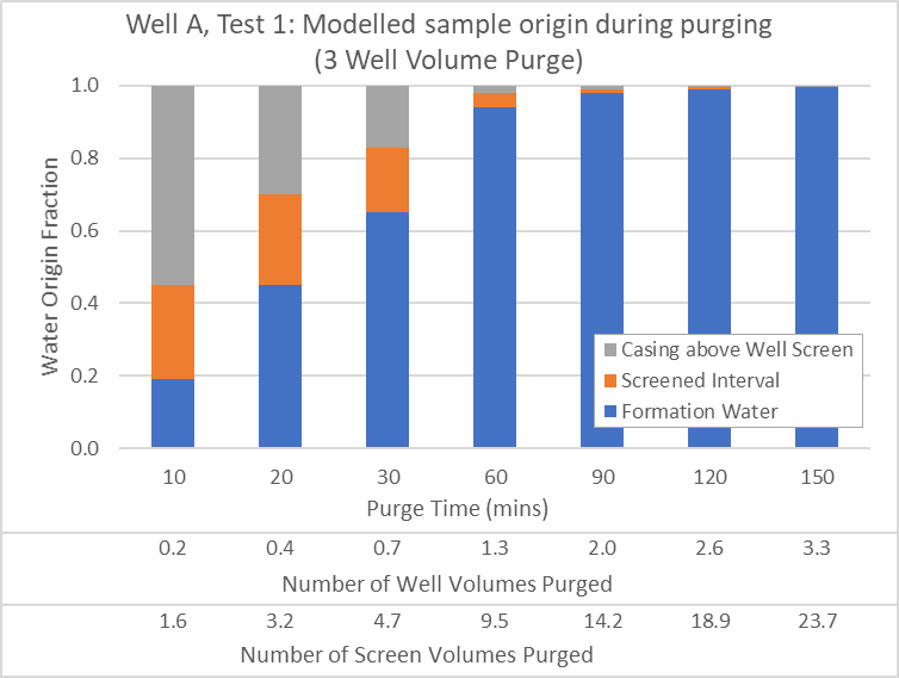
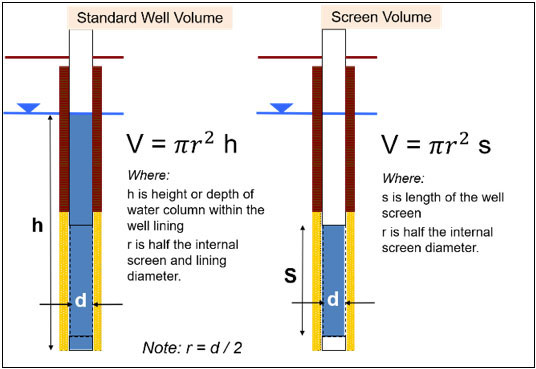
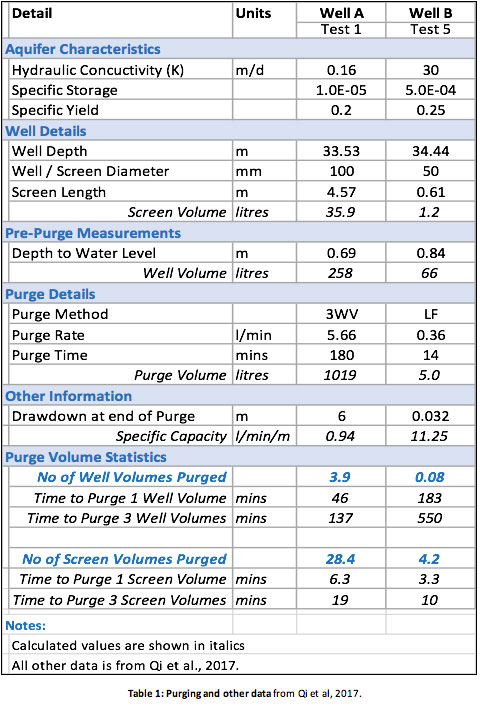
The authors’ results from modelling of the two wells are summarized here as Figure 1 (three well volume purging) and Figure 2 (low flow purging). I’ve used data from the paper to add horizontal scales to show the number of screen and well volumes purged (see Table 1 and Figure 3 below).
The paper expands on how the purge time to achieve a “representative sample” varies significantly in response to screen diameter and hydraulic conductivity (K). For example, low flow purging would be prolonged and impractical when K is <0.5 m/day. Interestingly, this is a significantly higher K value than that stated as a minimum for low flow in USEPA guidance (i.e. 10-5 cm/s or approx. 0.01 m/day).
Criteria for Representativeness
The authors define the “suitable sampling time point” (SSTP) as “the time point when the fraction of representative water reached 97%” (see Figures 1 and 2). However, they change their definition of what is representative water depending on the methodology used.
-
- For 3 well volume purge, “representative” water is stated as being that drawn entirely from the formation
- For low flow purge, the definition of representative water is extended to include water within the screened interval of the well.
Authors recognize that screen water isn’t always representative. However, this issue is critical and cannot be assumed (Martin-Hayden, 2014; McMillan et al, 2014 and 2018 and previous blogs (links below).

Comparison to Well and Screen Volumes
The authors’ model indicates that the “3 well volume purge” example (Figure 1) requires 1.7 well volumes (or 12 screen volumes) to achieve a fully purged sample.
The authors acknowledge that the pump was positioned in the well casing above the screen, whereas for comparison to modelling work by Martin-Hayden et al 2014, it would have been better if the pump intake had been within the screen.
The figure of 1.7 well volumes to achieve 97% formation water resonates with my own field experience in which stability of field chemical parameters was usually achieved within 2 well volumes (though we invariably continued to remove 3 well volumes to match guidance).
When using the low flow method (Figure 2), the model predicts that 2.6 screen volumes need to be removed to match the authors’ SSTP criteria, but 7 screen volumes to fully purge the well (i.e. to include removal of water from within the screen). This is twice the number of screen volumes modelled by Martin-Hayden et al, 2014 and McMillan et al, 2015 and 2018, leaving some food for thought.
Some Practical Comments
The modelling methodology proposed by Qi et all provides further evidence of the evolution of the origin of water sampled during purging using both 3 well volume and low flow purging methods.
The comparison to screen and / or well volumes purged is a useful indicator of purge status. The work by Qi et al 2017 indicates the need to purge at least 3 screen volumes using the low flow method.
This research confirms that low flow methods nearly always generate “partially purged” samples and relies on water within the well screen having similar chemistry to that in the adjacent aquifer. This may be the case in many wells – but not all.
The number of screen volumes purged in the low flow scenario broadly tie-in with other recent research. However, Martin-Hayden et al 2014, McMillan et al 2015 and, in particular, McMillan et al 2018, demonstrate that a partially purged sample, relying solely on chemical stability of field parameters, does not always reflect the stability of complex contaminants in the sample. It is important we state these uncertainties when interpreting water quality data.
If you are doing similar work using low flow purging, it is always worth recording the number of screen volumes purged to help with the interpretation of sample origin.
References
Shengqi Qi, Deyi Hou, Jian Luo, 2017. Optimization of groundwater sampling approach under various hydrogeological conditions using a numerical simulation model. Journal of Hydrology 552, 505–515. http://dx.doi.org/10.1016/j.jhydrol.2017.07.016
Martin-Hayden, J.M., Plummer, M., Britt, S.L., 2014. Controls of wellbore flow regimes on pump effluent composition. Ground Water Monit. Rem. 52 (1), 96–104. http://dx.doi.org/10.1111/gwat.12036.
McMillan, L.A., Rivett, M.O., Wealthall, G.P., Zeeb, P., Dumble, P., 2018. Monitoring well utility in a heterogeneous DNAPL source zone: insights from proximal multilevel sampler wells and sampling capture-zone modelling. Journal of Contaminant Hydrology, 210, 15-30. https://doi.org/10.1016/j.jconhyd.2018.02.001. (Open access – free to download)
McMillan, L.A., Rivett, M.O., Tellam, J.H., Dumble, P., Sharp, H., 2014. Influence of vertical flows in wells on groundwater sampling. Journal of Contaminant Hydrology, 169, 50-61. http://dx.doi.org/10.1016/j.jconhyd.2014.05.005 (Open access – free to download)
stong>Links to Related Blogs:
New Research Proposes Changes to Low Flow Guidance
http://www.in-situ-europe.com/index.php/news/new-research-proposes-changes-to-low-flow-guidance/
Low Flow Groundwater Sampling – a misunderstood methodology? Part One
http://www.in-situ-europe.com/index.php/news/cat/Peter-dumble-blog/post/low-flow-methodology/
Low Flow Groundwater Sampling – a misunderstood methodology? Part Two
http://www.in-situ-europe.com/index.php/news/cat/Peter-dumble-blog/post/low-flow-guidance/
Purge Volumes in Groundwater Sampling – Part 1
http://www.in-situ-europe.com/index.php/news/cat/Peter-dumble-blog/post/purge-volumes-groundwater/
Purge Volumes in Groundwater Sampling – Part 2
http://www.in-situ-europe.com/index.php/news/cat/Peter-dumble-blog/post/comparing-purge-volumes/
Screen Volume and Low Flow Groundwater Sampling
http://www.in-situ-europe.com/index.php/news/cat/Peter-dumble-blog/post/screen-volume-sampling/
Importance of Screen Length and Diameter
http://www.in-situ-europe.com/index.php/news/cat/Peter-dumble-blog/post/screen-length-groundwater-sampling/
Low flow Sample Origin
http://www.in-situ-europe.com/index.php/news/cat/Peter-dumble-blog/post/low-flow-sample-origin/
Representative Sampling
http://www.in-situ-europe.com/index.php/news/cat/Peter-dumble-blog/post/groundwater-sampling-long-screened-wells/
©Peter Dumble 2018