Monitoring a Remediation Process in Real-Time
Monitoring a Remediation Process in Real-Time
High-resolution monitoring saves time (and money!)
This study was conducted by Adam Hobson and his colleagues at S.S. Papadopulos & Associates in the United States.
It’s not often I get excited by new products, but I was recently given access to some real-time monitoring data collected by the new In-Situ Aqua TROLL 600 multiparameter water quality sonde, which has really excited me with the possibilities of the instrument.
For this blog, I thought I’d share a snapshot of the data record with you to give a flavour of what can be achieved by real-time, high-resolution monitoring.
Background and Data Record
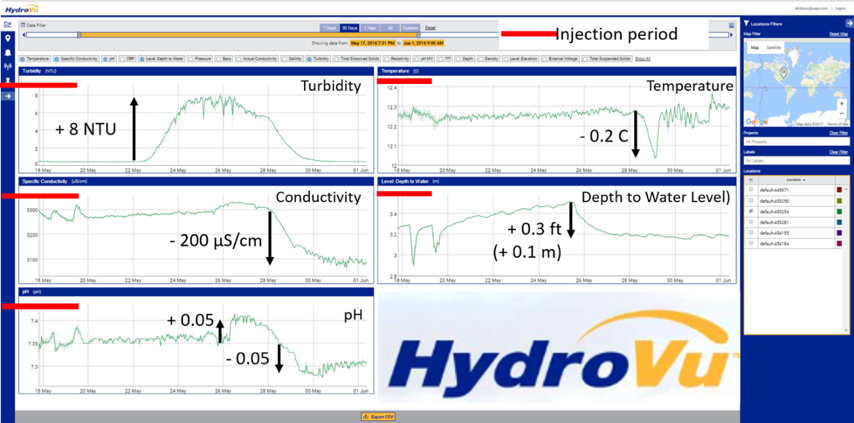
Five In-Situ Aqua TROLL 600 Multiparameter Sondes were positioned in monitoring boreholes 50 to 100 metres downgradient of another borehole used to inject a colloidal remediation fluid into a chlorinated solvent contamination source. The sondes were programmed to collect data every 15 minutes. The screen shot below shows the monitoring record from one of these locations over a period of 2 weeks following injection (each vertical line represents a 2 day period). Data was collected remotely and transmitted several times per day to In-Situ’s web-based platform, HydroVu Data Services.
Notes on Data Record
The main objective of monitoring was to try and identify the direction and speed of movement of the remediation fluid. Turbidity was chosen as an indicator to detect the presence of any (black) carbon-based reagent as it was diluted into the groundwater flow.
The graphical record shows a signifcant rise in turbidity (by 8 NTU) three days after the end of the injection works. This continued for a further 6 days before water quality returned to background concentrations.
Other physical and chemical changes reinforced the interpretation that this change could only have arisen from the injection process.
• A reduction in electrical conductivity by 200 uS/cm following the passage of the turbidity trace correlates with the addition of clean water following injection to help flush the remediation agent out of the borehole and into the groundwater system.
• A rise and fall in pH may be associated with the passage of remediation agent (small rise in pH) and the passage of the flush water (lowering of pH).
• A rise in water level (the graph is inverted) by 10 cm coincides with the addition of fluids. There was no rainfall during the monitoring period.
• The temperature change is erratic, but shows changes which also correlate with the passage of injection fluids.
All the observed changes are relatively small compared to background and relatively short-lived. It is unlikely these changes would have been detected using conventional field sampling and analysis methods.
In this case, high-resolution measurements identified changes in water quality which convincingly demonstrated the passage of the remediation fluid at the monitoring borehole.
This enabled a series of technical decisions to be taken very quickly to re-focus the remediation effort, which saved considerable time (and money) toward achieving effective remediation at the site.