Topics Covered
- What is blue-green algae (BGA)?
- Why measure BGA?
- What affects BGA in water, and what causes harmful algal blooms (HABs)?
- What methods are used to measure BGA?
- What are the units of measurement for BGA?
- How do Aqua TROLL sensors measure BGA?
- What are the challenges in measuring BGA?
- What makes Aqua TROLL BGA sensors unique?
- Which Aqua TROLL BGA sensor is right for your application?
- Additional Resources
What is blue-green algae (BGA)?
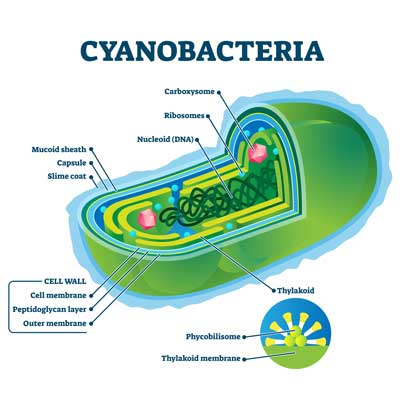
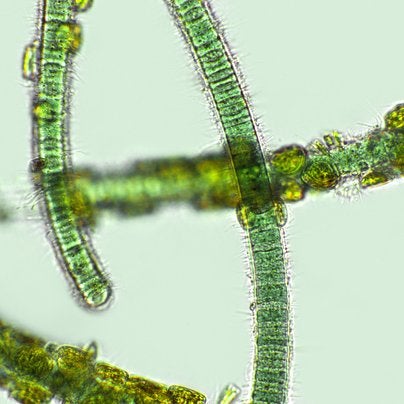
Blue-green algae (BGA) actually are not true algae. They are bacteria of a specific kind known as cyanobacteria, found in water. The common name is a misnomer from an era when BGA were classified alongside true algae. It does resemble algae when it is abundant and it has a bluish-green (cyan) color in many of its forms. It can also be red, yellow or brown in color.

BGA belong to a class of single-celled (prokaryotic) organisms that lack a nucleus or other membrane-bound organelles within the cell. BGA can aggregate to form larger colonies, held together by biofilms. These in turn can grow larger and become microbial mats. Many cyanobacteria possess gas vesicles — hollow, gas-filled protein structures (45–200 nm) that provide buoyancy. These properties have direct bearing on the environmental issue associated with BGA: harmful algal blooms (HABs; discussed in the next section).
BGA are photosynthetic organisms, using sunlight to transform carbon dioxide and water into carbohydrates and oxygen. BGA are the first organisms known to produce oxygen and are thought to be responsible for transforming Earth's prebiotic, anoxic atmosphere into an oxidizing atmosphere. They are among the oldest forms of life on Earth, having fossil records dating back over 3 billion years and possibly earlier.
Various colored molecules (pigments) within BGA do the work of capturing solar energy and converting it to the stored chemical energy of carbohydrates. These pigments include chlorophyll a, carotenoids and phycobilins. In BGA, the pigments are located within internal membrane sacs where the photosynthesis takes place. This is unlike plants, red algae and green algae, which have specialized internal organelles for carrying out photosynthesis such as chloroplasts and chromoplasts. BGA sensors focus on measuring two of the phycobilin pigments, phycocyanin (PC) and phycoerythrin (PE), because they are key BGA biomarkers. Unlike chlorophyll a, which is a pigment ubiquitous to plant life, the PC and PE pigments can be used to detect blue-green algae separately from typical green algae. Green algae is a true algae having a more complex cellular structure than BGA and is classified as a eukaryotic organism in the Plantae or Protista kingdom.
There are hundreds of species of BGA. Blue-green algae can be found in all aquatic habitats, from the tropics to the polar regions. Most are found floating freely in natural waters such as nutrient-rich ponds, lakes, and slow-moving rivers, coastal areas, and estuaries. They can also occur in wet walls and ditches.
Why measure BGA?
It is important to monitor BGA because of its impact on the aquatic ecosystem and its lifeforms, its threat to drinking water safety and recreational activities, and its negative health effects on humans, wildlife, livestock and pets. Countries and localities suffer large economic losses annually related to BGA and its harmful effects.
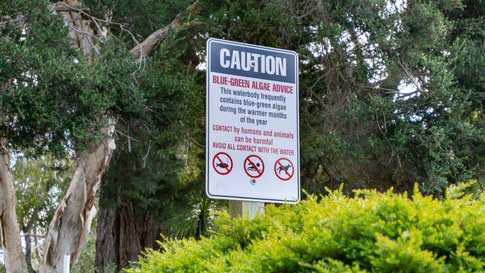
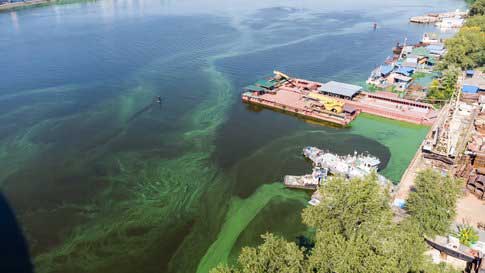
Harmful algal blooms (HABs): Blue-green algae can become over-abundant and are notorious for forming "blooms" of floating mats or scum on the water's surface. The rapidly growing blooms can sharply deplete dissolved oxygen as large amounts of biomass decompose. The resulting oxygen-poor (hypoxic) environment can lead to fish kills and have other effects that ripple through aquatic communities. The aquatic effects can negatively impact human and animal health, as well as commercial and recreational water activities including fishing. For this reason the blooms are called harmful algal blooms, or HABs. HABs are harmful because of the bloom itself as discussed above but can also be harmful because of the presence of toxic substances that can co-occur with the bloom. Note that HABs are caused by diverse organisms, which in addition to BGA includes noxious phytoplankton, benthic algae (which occur on the bottom of water bodies), and macroalgae.
Cyanotoxins: BGA can produce toxins (generally called cyanotoxins) that are harmful to aquatic life, as well as humans and other animals. Not all BGA produce toxins and appearance alone does not indicate whether a bloom is toxic. The cyanotoxins include:
- microcystins and nodularins (cause liver damage and possibly damages kidneys and reproductive systems)
- cylindrospermopsin (affects multiple organ systems)
- guanitoxin (causes respiratory failure)
- saxitoxins (neurotoxins that can cause paralysis)
- lyngbyatoxins (promote tumors, acute dermatitis or "swimmer's itch", and eye or respiratory irritation)
Removing cyanotoxins from water sources of drinking water treatment facilities is especially challenging. Conventional water treatment (coagulation, filtration, chlorination) generally removes the bloom material but does not remove dissolved toxins. Additional treatment steps of ozone or activated carbon are used if warranted. Large HAB events can overwhelm capacity at these processing plants.
Health effects: Humans and animals that encounter water affected by HABs and cyanotoxins can become sick and even experience life-threatening illnesses. Exposure can occur by contact with water, swallowing water, or inhaling airborne droplets of water that is affected by blue-green algae blooms. Humans and other animals can also get sick by ingesting fish, seafood or drinking water that has become infected. Human health effects include diarrhea, nausea and vomiting; irritation of skin, throat or eyes; liver damage; neurological symptoms; and allergic reactions including breathing difficulties. Vulnerable populations include children, pregnant women, elderly, immunocompromised individuals, and those with pre-existing liver disease. Animals that are most at risk include pets, livestock, wildlife, fish and other aquatic life. Thousands of livestock fatalities worldwide have been linked to bloom-contaminated water. Reported deaths include cattle, horses, sheep, birds and wildlife. Dogs are especially vulnerable.
Ecological effects: HABs cause cascading ecological damage. Hypoxia from decomposing biomass creates dead zones and fish kills, dense surface scums shade submerged aquatic vegetation, biodiversity declines, and the food web structure shifts.
Benefits of monitoring: Because of these health and ecosystem effects, monitoring BGA is crucial for several reasons. Monitoring helps protect the public health and environment by predicting blooms and assessing the risk of harmful concentrations of cyanotoxins. In drinking water treatment plants, early detection via continuous monitoring allows operators to activate additional treatment steps (activated carbon, ozone) to prevent cyanotoxins from reaching consumers. Monitoring also supports environmental management of the overall health of water bodies and guides resource management of the use of water bodies for recreation, fisheries and aquaculture. And monitoring is fundamental to research and development, which in the long run leads to a deeper understanding of how and why HABs form. This R&D ultimately supports the development of better HAB "forecasts" as well as possible strategies to prevent HABs.
Regulatory drivers of monitoring: Many countries have regulations for cyanotoxins (primarily microcystins) related to drinking water and recreational water quality, and the World Health Organization has issued guidelines. In the U.S., the Environmental Protection Agency has federal criteria for water quality and some states have additional regulations.
Monitoring applications: Monitoring is a valuable tool in natural and manmade environments. Monitoring efforts have benefits for ecosystem health, public health, agriculture, fisheries, aquaculture, recreational industries and tourism.
- lake, reservoir and river health
- coastal and estuarine studies
- drinking water safety
- recreational water safety
- aquaculture and fisheries protection
- livestock and wildlife protection
What affects BGA in water, and what causes harmful algal blooms (HABs)?
HABs occur when colonies of algae grow out of control. Conditions are ripe for the formation of HABs when temperatures are warm, water circulation is sluggish, and nutrients are rich. According to NOAA, while we know of many factors that may contribute to HABs, how these factors come together to create a "bloom" of algae is not well understood1.
Water temperatures above 25°C are optimal for BGA growth, and they outcompete algae at warmer temperatures. Stagnant conditions favor blooms because of the buoyancy regulation that occurs in BGA. Many BGA possess gas vesicles — hollow, gas-filled protein structures (45–200 nm) that provide buoyancy. Cells regulate their position in the water column by accumulating or depleting carbohydrate ballast through photosynthesis. Overnight, cells consume carbohydrate reserves and become buoyant, floating to the surface by morning. This places BGA in the ideal position for harvesting the light for photosynthesis and gives BGA a competitive advantage over algae and other plant life that are shaded below. During daytime photosynthesis, carbohydrate accumulation increases cell density and causes sinking. As the cycle repeats, the stagnant conditions favor blooms. It is rare to find blooms in flowing rivers.
Extreme events such as floods and hurricanes can lead to HABs, but stormy weather can also have the opposite effect by depriving the algae of light, causing them to die and decompose.
In addition to the natural factors such as temperature, wind and water currents that can create conditions favorable to HAB formation, human activities can also play a role by "overfeeding" the water environment. This process, called eutrophication, occurs when nutrients (mainly phosphorus, nitrogen and carbon) enter water bodies from sources such as animal manure, septic systems, wastewater and runoff from sources such as urban stormwater, lawns and farmlands. The phosphorus and nitrogen in fertilizers are a key part of the problem, because they act as food for the bacteria's growth.
Another anthropogenic factor related to the occurrence of HABs is climate change. Warmer water temperatures create conditions for potentially toxic algae to bloom at depths where it hasn't in the past. More extreme precipitation events can contribute to HABs by the increased nutrient loading from storm runoffs. Data suggests that blooms are increasing in frequency worldwide, are lasting longer, and are forming earlier each year and in previously unaffected locations.
BGA blooms may last from a few days to several weeks. The blooms are seasonal, occurring from late spring to early fall and peaking in midsummer. BGA spreads rapidly and doubles every one to two weeks. This runaway growth will keep going until either the climatic conditions change, or until the onset of autumn and winter breaks it up because of declining sunlight and temperature. BGA and algal growth are stopped in lakes when they "turn over" every winter, a process in which surface water becomes colder than deeper water and the two water masses essentially trade places.
-------------------
1 National Oceanic and Atmospheric Administration (NOAA), Why do harmful algal blooms occur? National Ocean Service website, Why do harmful algal blooms occur?, 6/16/2024. Accessed 4/14/2026.
What methods are used to measure BGA?
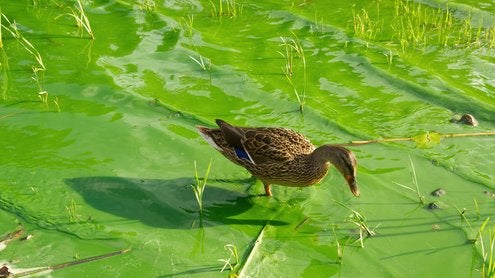
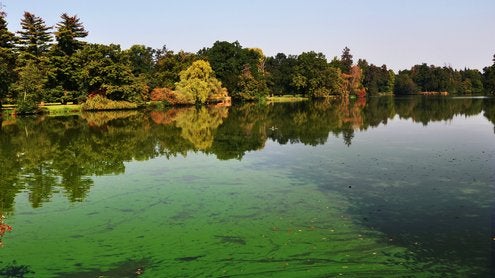
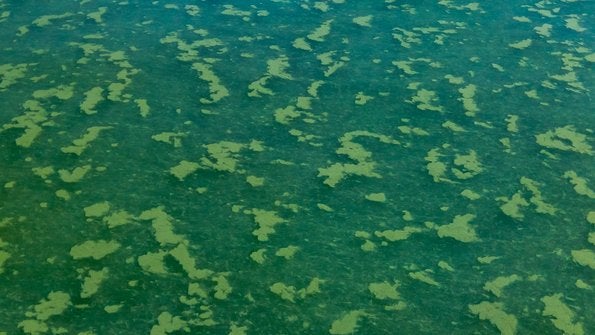
The presence of BGA in water bodies has telltale signs visible to the naked human eye: water discoloration (often bluish-green) and the formation of surface scums and mats. While mature BGA blooms can sometimes be seen upon visual inspection, waiting for visual confirmation often delays critical public health and water treatment interventions. Quantitative measurement methods can help scientists better understand the dispersion of algae and detect newly forming blooms before they are visible.
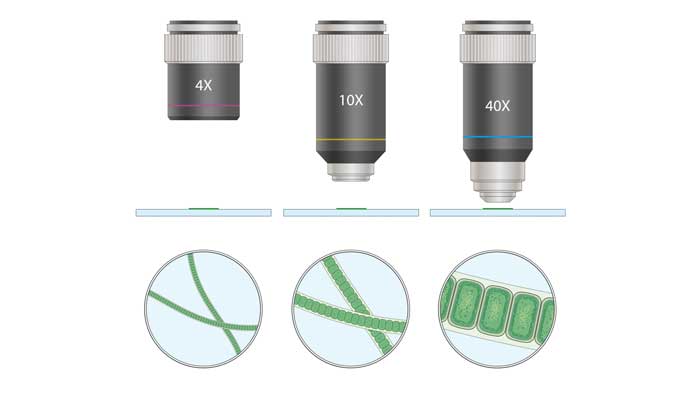
Microscopy: In this method, the water is sampled and may be concentrated and/or extracted and then is examined under a microscope in the laboratory. Cyanobacteria are identified and counts are done to determine BGA levels. This method is moderate in cost and provides information on species composition but is time consuming.
Spectrophotometry: Water samples are concentrated or extracted and put into a spectrometer in the laboratory, where absorbance is measured at wavelengths appropriate for BGA pigments like phycocyanin and phycoerythrin. This method is relatively inexpensive and quick per sample but is costly when carried out at scale, and it can have interferences from other absorbing compounds.
Fluorometry: Fluorometry is a sensitive method and is the only technique that can measure natural levels of BGA by placing the sensor directly in the water being measured, without sample collection/extraction and laboratory analysis. It is the primary method for measurements in real time within the water body. The method takes advantage of the natural fluorescent properties of pigments that are specific to BGA, primarily phycocyanin (most commonly found in freshwater BGA) and phycoerythrin (most commonly found in marine and brackish environments). The fluorometer shines light at a wavelength appropriate for the BGA pigment through a sample. The pigment absorbs the light and then fluoresces (re-emits) light at a longer wavelength. A photodetector measures the intensity of the emitted fluorescence.
The amount of light fluoresced varies for different species of the BGA. Species vary by size, shape, and types of accessory pigments, all of which can affect light output. The cell walls and other cellular structures can alter the path of light into or out of the cell. The PE and PC pigments are actively involved in biological processes within cells, which can affect how much light is fluoresced. In addition, the amount of light fluoresced by any individual organism varies by the age, health, environment and past light history of that individual. For these reasons, fluorometers provide measurements in Relative Fluorescence Units (RFUs) of the BGA pigments; they do not directly provide the concentration or cell count of the pigment.
Because of the many factors that affect the fluorescence intensity, the correlation of measured RFUs to concentration or cell count needs to be determined empirically for each specific deployment site. The investigator must develop site-specific correlations using sampling and spectrophotometry, and be aware that the correlation can change with time.
Fluorometers designed for long-term deployment and continuous monitoring, as well as handheld fluorometers for spot checking, are available on the market. These instruments typically enable increased spatial and temporal resolution of measurements, which can complement grab sampling/laboratory analyses that are limited to one location at a single point in time. Limitations of the method include interferences from suspended particles (turbidity) and ambient light. The method can also have interferences if other compounds fluoresce at the wavelengths being used to detect the BGA. Fluorometric measurements are a proxy for BGA biomass, and they do not provide information on cyanotoxin concentrations.

Satellite remote sensing: Spectral bands for phycocyanin are used in satellite platforms such as Sentinel, MODIS and Landsat that provide ongoing large-area surveillance of entire water bodies. The satellite data are valuable for BGA trend analysis and can identify areas that should be prioritized for field work. In the U.S., a multiagency project called the Cyanobacterial Assessment Network (CyAN) uses Sentinel data to detect BGA blooms across the largest lakes and reservoirs and has a mobile app that provides weekly satellite data on blooms. Limitations of the method include interference by clouds, coarse spatial resolution, inability to measure subsurface blooms and cyanotoxins, and one- to two-day processing delays.
In addition to these methods for detecting BGA, specific cyanotoxins from the BGA can be measured by laboratory tests. Immunoassays use antibodies that bind to a targeted cyanotoxin, which is then quantified. This is relatively quick and moderate in cost, but its specificity means that other cyanotoxins won't be detected. Liquid chromatography/mass spectrometry is a test that separates and then measures specific cyanotoxins. This is a high-cost method requiring an expensive mass spectrometer but has the advantage of being able to detect multiple toxins.
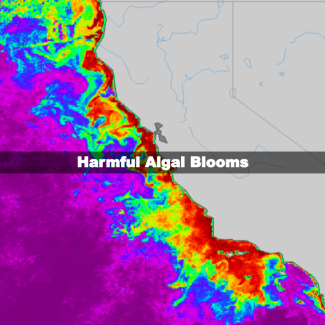
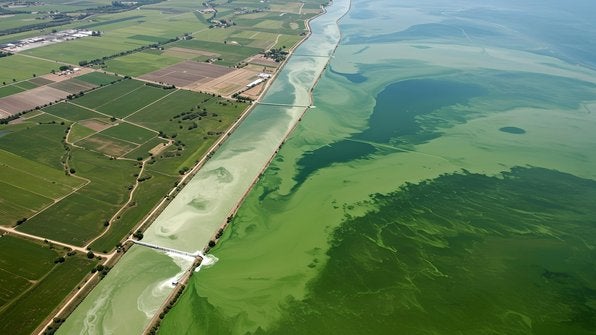
[Image credit: National Oceanic and Atmospheric Administration (NOAA) CoastWatch.]
What are the units of measurement for BGA?
The absolute units of measurement for BGA concentration are parts per billion or micrograms per liter (μg/L), which are the units often required for regulatory reporting. Microscopy provides cell counts (cells/mL). These are laboratory measurements conducted on samples taken from the water body. The measured concentrations and cell counts are very dependent on the species mix of the algal population, the health of that population, and environmental factors such as season and time of day. Thus, a measured concentration value does not give a measure of the number of BGA cells, and a doubling of the measured concentration does not mean the algal population has doubled. But if the algal populations are fairly stable at a site, good correlations of concentration and population can be established.
For fluorescence-based monitors deployed within the water body, the preferred units are relative fluorescence units (RFUs). An RFU measurement is usually represented by a scale from 0 to 100, where 0 indicates no fluorescence and 100 represents maximum fluorescence normalized via laboratory comparisons to a stable secondary standard. RFU measurements exhibit excellent linearity.
The term "relative" is key to understanding that RFUs are related qualitatively to the concentration of the fluorescent BGA pigment, but they do not provide a concentration without a site-specific correlation, as mentioned in the previous section. A site-specific correlation can be developed by comparing grab samples with fluorescence values from the sensor. Determining the relationship between RFUs and laboratory-measured concentrations for a given site will require correction for environmental factors such as temperature and turbidity.
An RFU is the sensor's raw value converted into a relative scale and is determined relative to the sensor’s range of measurement. An important point to note is that the RFU readings of different manufacturers' sensors cannot be benchmarked against each other without cross calibrations. For example, different manufacturers use slightly different wavelengths in their measurements. Side-by-side comparisons cannot be made without carrying out RFU calibrations to establish comparability.
BGA monitoring is best approached as an assessment of trends and changes in the algal population, where users can establish their own thresholds for how much change might lead to follow-up measurements or actions.
How do Aqua TROLL sensors measure BGA?
The Aqua TROLL BGA sensors are fluorometers that are deployed on the Aqua TROLL multiparameter sondes. Two sensors are offered related to BGA, one for measuring the phycocyanin pigment (PC) and one for measuring the phycoerythrin pigment (PE).
Fluorescent molecules absorb light from a specific excitation wavelength and then emit light at a different, longer wavelength. Only some substances have molecular structures that cause them to fluoresce. Fluorometers measure these molecules using a carefully designed system. An LED emitter generates light in a specific wavelength range, and filters isolate the desired excitation spectrum. When this light reaches fluorescent molecules in a water sample, they absorb the energy and emit light at a longer wavelength (lower energy). This emitted light is known as the fluorescence signature. The sensor's detector, equipped with its own set of filters, captures the emitted light and measures its intensity.
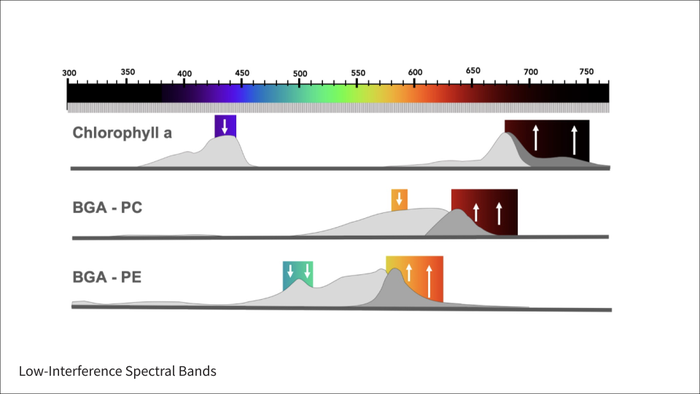
The excitation wavelength and detection wavelength are chosen to target the specific molecule being detected and minimize interferences with other absorbing molecules. For the Aqua TROLL BGA-PE sensor, the excitation light has a wavelength of 498 nanometers and the fluoresced light is detected at 575−625 nanometers. For the Aqua TROLL BGA-PC sensor, excitation and emission occur at 590 and 640−690 nanometers, respectively.
Because fluorescence intensity is proportional to the concentration of fluorescent molecules, the sensor can estimate the concentration of target substances in the water. As concentration increases, more molecules absorb the excitation light, resulting in stronger fluorescence. In the Aqua TROLL PC and PE sensors, the intensity is roughly proportional to the BGA pigment's concentration, which in turn is a proxy measure of the BGA biomass.
Measurements are typically expressed in Relative Fluorescence Units (RFUs). RFUs indicate relative changes in concentration of the fluorescent substance as measured by the particular sensor, but they do not provide an exact concentration without a site-specific correlation.
Aqua TROLL fluorometers have several features that optimize performance and reliability, which are described in a separate section below.
What are the challenges in measuring BGA?
Fluorometric Methods
Most of the challenges of monitoring PC and PE are universal for optical or fluorescence measurements in water. However, while some fluorometry challenges are strictly physical or chemical, BGA is a biological parameter. This creates unique challenges for BGA monitoring, which are covered in the last entry of this section, "Correlational Accuracy."
Fouling
The most notorious challenge when monitoring BGA in the field is fouling. When biofouling or physical fouling (such as sediment deposition) obstructs the sensor window, the sensor cannot deliver or receive light. This process is essential to sensor functionality; any fouling that blocks the sensor window will therefore interfere with BGA measurements. A regular maintenance cycle coupled with a wiper or other accessories are essential measures for reliable data collection with optical sensors.
Temperature
For all fluorometers, there is an inverse relationship between fluorescence and temperature. This presents the greatest challenge at very low ranges of sensor detection. On-board temperature sensors can help with understanding the influence of temperature on BGA measurements and enable temperature corrections. While changes in the sensor response are compensated by the sensor itself, an on-board temperature sensor can help with understanding the influence of temperature on how algae may fluoresce differently at different temperatures. The importance and level of temperature's effect on fluorescence is project specific and any corrections should be developed empirically on a project-by-project basis.
Turbidity
All optical sensors experience interference from turbidity. Particulates in water can interrupt a clear path for light to travel to and from the sensor. Also for BGA monitoring, the same cells that are absorbing light may also increase the turbidity of the water. Thus, the relationship between turbidity and the target parameter is complex. It is not always linear and can be influenced by different particle types. In all cases, however, turbidity is most likely to lead to an underestimation of the target parameter. Best practice is to always measure turbidity alongside any fluorescence or absorption measurement. At the very least, this enables an awareness of possible turbidity interference. In some cases, turbidity measurements can help develop a mathematical correction for turbidity interference. The threshold at which turbidity interference occurs, in either nephelometric turbidity units (NTUs) or formazin nephelometric units (FNU), depends on both the monitoring site and project objectives. Any turbidity corrections must be developed empirically from site-specific measurements.
Inner Filter Effects
Interference from the inner filter effect can occur in environmental monitoring. "Inner" refers to a light-filtering effect created by compounds contained within a sample. For example, if there is a very high concentration of the BGA pigment being monitored, molecules may absorb some of the excitation light, reducing the amount of light that reaches molecules deeper in the sample (called the primary inner filter effect). Emitted fluorescence might also be absorbed by other molecules in the water (the secondary inner filter effect). Both of these processes lead to a non-linear response and an underestimation of the BGA pigment.
One way to test for inner filter effects is to collect samples and dilute them, to see if there is the expected linear response of the BGA measurement and the sample dilution. As with temperature and turbidity, the objectives of the monitoring program must drive the decision of whether and how to address these interferences.

Correlational Accuracy
The factors that affect BGA in water also affect the relationship between measured fluorescence and the pigment concentration or algal biomass. For example, the RFU measured in winter might correlate with a different overall biomass concentration than the same RFU measured in summer. This is why a fluorometry sensor cannot actually measure µg/L or ppb directly in the environment.
Users can build their own correlations, taking extractive spectrophotometric measurements from field locations where BGA sensors are deployed. This is an excellent practice and often a necessary one for regulatory reporting (especially where µg/L is a required unit, for example), but it has limitations. A sensor in water sees the BGA pigment that is free floating, as well as the BGA pigment that is attached to both living and dead cells. Extractive methods used to build correlations cannot capture all forms of the BGA pigment. It is important to consider these discrepancies when building correlations and interpret correlations carefully.
BGA field sensors are extremely helpful for capturing and responding to real-time changes in algal populations and understanding long-term trends. They enable high-resolution data collection at relatively low cost, delivering much larger datasets for a fraction of the time and resources required by grab sample collection and laboratory analysis. However, it is generally regarded as best practice to couple extractive methods with field-deployable BGA sensors, especially for research purposes that require highly accurate measurements.

Water Sampling Methods
Several common mistakes can compromise the accuracy and reliability of blue-green algae measurement methods that require sampling:
- Improper Sampling: Collecting samples from non-representative locations or at inappropriate times of day can lead to inaccurate results. It is important to collect samples from areas with visible blooms and at times when algal activity is highest.
- Inadequate Preservation: If samples are not properly preserved, toxins can degrade, leading to underestimation of toxin levels.
- Cross-Contamination: Contamination of samples during collection, transport or analysis can lead to false-positive results.
Understanding and avoiding these sampling challenges is crucial for ensuring the accuracy of blue-green algae testing.
What makes Aqua TROLL BGA sensors unique?
Integrated Optical Compensation
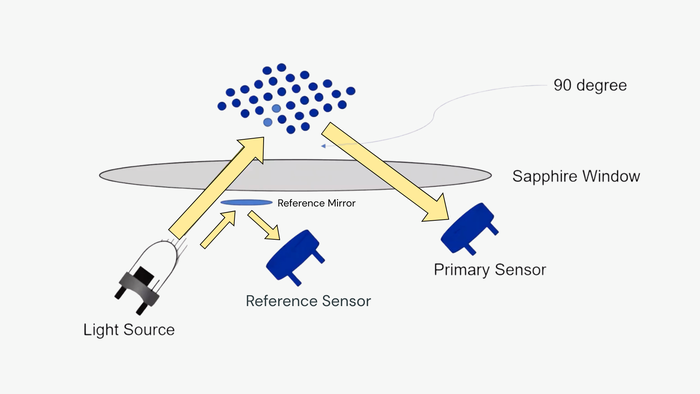
Optical sensor LED brightness will decrease with prolonged use like with any equipment. Aqua TROLL BGA sensors include a primary detector and secondary reference detector to measure LED drift and automatically compensate each reading. This provides stability at much lower limits of detection and significantly reduces sensor drift over temperature and time.

Isolated Optical Frequencies
In most water quality platforms, installing more than one optical sensor causes interference among sensors. Each Aqua TROLL optical sensor runs at a unique frequency that creates a digital signature for each light source. Detectors for BGA sensors use this signature to isolate PC and PE wavelengths from other light sources and measure only the targeted parameter. This allows multiple optical sensors to run simultaneously in one instrument.

Ambient Light Rejection
Environments with ambient light can pose challenges for optical measurement methods if sensors can't distinguish between external and internal light sources. Aqua TROLL BGA sensors separate light from the sensor from other ambient light sources, enabling the same degree of accuracy regardless of lighting conditions or deployment location and providing consistent monitoring and calibration across different sites.

Narrow Spectral Bands
Interferences between sensors and inaccuracies in BGA monitoring data are more likely to occur when fluorometers excite a wider range of wavelengths. Aqua TROLL fluorometers include one parameter per sensor. Each sensor excites a small range of the light spectrum to increase accuracy while minimizing interference from other fluorescence sources. Three separate sensors are offered: BGA-PC (phycocyanin), BGA-PE (phycoerythrin) and Chlorophyll a.
Which Aqua TROLL BGA sensor is right for your application?
 Aqua TROLL Blue Green Algae Sensor: Phycocyanin (BGA-PC)$1,995.00Pricing only valid in the U.K.
Use to accurately measure phycocyanin cyanobacteria in freshwater environments.
 Aqua TROLL Blue Green Algae Sensor: Phycoerythrin (BGA-PE)$1,995.00Pricing only valid in the U.K.
Use to accurately measure phycoerythrin cyanobacteria in marine environments.
 Aqua TROLL Chlorophyll a Sensor$1,995.00Pricing only valid in the U.K.
Use with the Aqua TROLL 500 and 600 multiprobes to measure chlorophyll a.
 Aqua TROLL 500 Multiparameter Sonde$0.00Pricing only valid in the U.K.A fully customizable five-port multiparameter sonde with capacity for four interchangeable sensors and an antifouling wiper. A smartphone interface delivers accurate data and enables simplified calibration, panoramic data view and report creation. Ideal for spot-checking and profiling applications when used with a TROLL Com Plus or for long-term monitoring with VuLink telemetry.
 Aqua TROLL 600 Multiparameter Sonde$4,295.00Pricing only valid in the U.K.
A fully customizable multiparameter sonde with interchangeable sensors, long-lasting battery power, and a smartphone interface that delivers accurate data and enables simplified calibration, panoramic data view and report creation. Ideal for short-term and long-term deployment. Available in vented and non-vented options.
 Aqua TROLL 700 Multiparameter Sonde$4,220.00Pricing only valid in the U.K.
A fully customizable multiparameter sonde with interchangeable sensors, long-lasting battery power, and a smartphone interface that delivers accurate data and enables simplified calibration, panoramic data view and report creation. Ideal for short-term and long-term deployment. Available in vented and non-vented options.
 Aqua TROLL 800 Multiparameter Sonde$6,330.00Pricing only valid in the U.K.A fully customizable seven-port multiparameter sonde with capacity for six interchangeable sensors and an antifouling wiper. A smartphone interface delivers accurate data and enables simplified calibration, panoramic data view and report creation. Ideal for short-term and long-term deployment. Available in vented and non-vented options.
- Webinar Solutions for Effective Harmful Algal Bloom Monitoring: Instrumentation, Methods and Best Practices
- Webinar Making Sense of Your Harmful Algal Bloom Data
- Webinar Top 3 Reasons to Switch to Long-Term Harmful Algal Bloom Monitoring