Topics Covered
- What is FDOM?
- What are the units of measurement for FDOM?
- What affects FDOM levels in water?
- Why measure FDOM?
- What methods are used to measure FDOM?
- How do In-Situ sensors measure FDOM?
- What are common challenges when monitoring FDOM?
- What makes In-Situ FDOM sensors unique?
- Which FDOM sensor is right for your application?
- Additional Resources
What is FDOM?
Fluorescent dissolved organic matter (FDOM) is a key parameter in water quality monitoring that helps us understand the presence, types and turnover of organic materials in water. To understand FDOM, it helps to understand its relationship with other forms of organic matter.
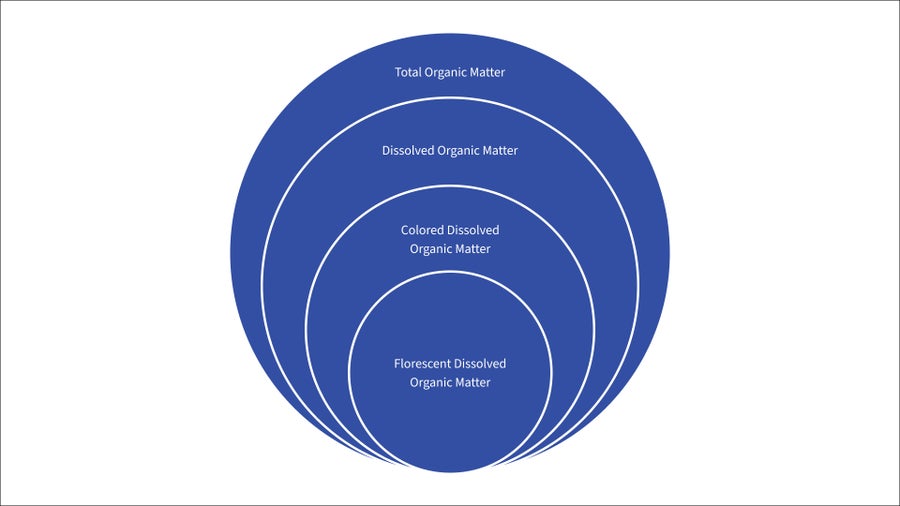
Total organic matter (TOM) encompasses all dissolved and particulate forms of organic matter in water, living or nonliving, dissolved or undissolved. Dissolved organic matter (DOM) is the portion of TOM that can pass through a 0.45 µm filter, while particulate organic matter(POM) is the portion of TOM retained by the filter.
In natural water bodies, POM tends to settle out, or be broken down or consumed by organisms, eventually becoming DOM. Though proportions will vary, most TOM in an aquatic environment exists as DOM, which largely includes complex macromolecules such as
- Humic and fulvic acids
- Proteins and amino acids
- Carbohydrates
- Lipids
- Any other compound that can pass through a 0.45 µm filter
Colored DOM, called CDOM, is the portion of DOM that absorbs light. CDOM can lend a brownish or yellowish tinge to water that is visible to the eye. Fluorescent dissolved organic matter (FDOM) is the portion of CDOM that not only absorbs light, but also emits light via the process of fluorescence.
All forms of organic matter can be measured in a laboratory. Instrumentation for directly measuring organic matter in the environment, however, usually features CDOM and FDOM as the targeted parameters. This is because the light-absorbing—and in the case of FDOM, light-emitting—properties of CDOM and FDOM lend themselves well to immersible sensor technologies. Since fluorescence is a more sensitive measurement tool than absorbance, FDOM has emerged as the preferred parameter for monitoring organic matter in lakes, rivers, streams, and estuarine and coastal environments.
To read more about CDOM and FDOM’s relevance to water monitoring applications, see “Why measure FDOM?”
When considering FDOM’s relevance to water monitoring applications, it’s also important to consider total organic carbon (TOC). All organic materials, by definition, contain carbon. Logically, then, there is substantial overlap between the categories of total organic matter (TOM) and total organic carbon (TOC). But in practice, “TOC” is used to describe a special group of compounds that can be converted to carbon dioxide (CO₂) through high-temperature combustion in air. That is not true of all compounds in TOM, especially those that contain high amounts of nitrogen or phosphorus.
For water monitoring purposes, TOC mainly captures complex organics like humic and fulvic acids. As mentioned above, the category of total organic matter (TOM) encapsulates dissolved as well as undissolved organic matter. Similarly, some TOC will dissolve in water, while some TOC remains undissolved. Humic and fulvic acids are located at the intersection of TOC and DOM. In other words, humic or humic substances are collective terms for dissolved compounds under the umbrella of total organic carbon (TOC).
While humics present problems for water quality (see “Why measure FDOM?”), they are also naturally fluorescent. So, when monitoring FDOM, humics or humic substances are usually the analytes of interest.
What are the units of measurement for FDOM?
The two most common units of measurement for FDOM are Relative Fluorescence Units (RFU) and Quinine Sulfate Units (QSU).
QSU is the common standardized unit, where 1 QSU equals the fluorescence of 1 µg/L of quinine sulfate in 0.05 Molar sulfuric acid. To use QSU, the sensing instrument must be calibrated against QS reference standards.
Several challenges are associated with these standards:
- High-purity quinine sulfate dihydrate is required.
- Precise acid concentration is essential.
- Standards are temperature sensitive.
- Standards degrade with light, so must be stored in the dark.
- Shelf life is limited.
- Standards are easily contaminated.
- Disposal must be handled carefully.
Because of these requirements, and to improve reliability and traceability, most people prefer to purchase commercial QS standards. Standards can be costly and degradation and contamination after opening limits standard shelf life. This leads costs of standards to accumulate quickly. Safe handling and disposal pose an additional challenge for field-based applications.
Relative Fluorescent Units (RFUs) are generally viewed as the more convenient unit of measurement. An RFU measurement is determined relative to an instrument’s range of measurement, usually represented by a scale from 0 to 100, where 0 indicates no fluorescence and 100 represents maximum fluorescence.
The term ‘Relative’ is key to understanding that this measurement is a qualitative indicator of concentration. RFUs will give relative changes in concentration of the fluorescent substance but will not provide an exact concentration. To determine exact concentration, one must perform a site-specific calibration which involves simultaneously comparing water samples for laboratory analysis along with FDOM values. Determining the relationship between FDOM RFUs and laboratory-measured DOC will require correction for environmental factors such as temperature and turbidity.
The range of RFUs can be correlated to a secondary standard–including QS standards–to understand a sensor’s scale of measurement. If one wants to avoid the hassles of QS standards, solid state standards are an excellent option for understanding and calibrating the RFU scale. For more on solid state standards and calibrators, see “How do In-Situ sensors measure FDOM?”
Both QSUs and RFUs enable highly sensitive measurements because monitoring technologies rely on fluorescence, which is a more sensitive tool than light absorbance. For more detail on the process of fluorescence and how it provides this sensitivity, see “What methods are used to measure FDOM?”
QSUs offer one main advantage over RFUs as a standardized unit: they enable the comparison of FDOM readings from different instruments. Measurements in RFUs are comparable between instruments of the same type and manufacturer because they will have the same RFU scale relative to a standard (solid state or QSU). However, reference scales for RFUs will not be the same between manufacturers. So, comparing RFUs between different manufacturers’ instruments is not recommended. If such comparisons are necessary, RFUs can be correlated and normalized against QSUs as a standardized unit.
Taking field measurements always comes with risks of interferences (see “What are common challenges when monitoring FDOM?”). Whether using QSU or RFU, absolute measurements are difficult to capture. Therefore, FDOM monitoring is best approached as an assessment of trends and changes in water quality, where users can establish their own thresholds for how much change might lead to follow-up measurements or actions.
What affects FDOM levels in water?
Monitoring FDOM helps water managers understand the dynamics of organic matter transfer in a system and make informed decisions if action is required. DOM in natural waters comes from both natural processes and human sources.
The composition and concentration of DOM—and therefore FDOM—resulting from natural sources can vary based on
-
Landscape and vegetation
-
Seasonal patterns
-
Land use
-
Biological activity in and around the water body
The size, hydrology, and structure of the water body itself also influence how organic matter accumulates or moves throughout the system.
Growing populations have increased human influence on the levels and types of organic matter in water bodies. This trend underscores the importance of monitoring FDOM to understand potential impacts on water quality and ecosystem health.
Natural Sources
FDOM can enter waterways naturally through the decomposition of plant material. This includes organic matter from the forest floor, decomposing wetland and peatland vegetation, and aquatic plants such as decaying algal blooms. FDOM can also reach surface waters through leaching—when water seeps through soil and transports organic matter—and from heavy rains that erode soils or carry organic materials via stormwater runoff.
Groundwater may also contribute to FDOM levels when it travels through nutrient-rich soils and sediments, picking up organic matter along subsurface pathways.
Algal and microbial activity—both growth and decay—also influence the levels of organic matter in aquatic systems. In coastal environments, deep water upwelling can transport organic material upward, raising FDOM concentrations near the surface.
Wetlands and estuarine environments further impact FDOM levels by acting as both storage and export zones for organic carbon, playing a key role in the natural carbon cycle.

Human Sources
Wastewater treatment plant effluent and industrial discharges can contribute FDOM to natural waterways if dissolved organic compounds are not completely removed through the treatment process. Even when removed through treatment processes, some residual FDOM may enter water bodies and build up over time. If improperly managed, sludge involved in wastewater treatment can leach into effluent and contribute dissolved organic matter to natural waters.
Agricultural activities are a large contributor of FDOM to natural waterways. Many agricultural substances are rich in FDOM and other forms of organic matter. Organic fertilizers such as manure, compost and biosolids are high in DOM. Similarly, some pesticides and herbicides contain organic compounds with fluorescent properties. When any of these substances are applied to agricultural fields, they can enter groundwater sources through the soil or enter waterways through surface water runoff or agricultural irrigation practices, such as subsurface drainage. Pasture runoff can also contribute organic matter from animal waste, crop residues, plant litter and soil erosion into surface waters.
Urban landscapes can contribute many of the same organic pollutants to natural waterways that agricultural landscapes do. Leaves, grass clippings and yard waste can wash into storm drains and surface waterways, influencing FDOM levels by increasing decaying plant matter in urban waters. Wastewater treatment plants are not the only source of effluent; urban environments can increase FDOM if infrastructure leaks, aging septic systems or waste from other untreated sources makes its way into stormwater drains. Soil erosion–from construction sites, parks or other open areas–can also increase FDOM levels. And fluorescent matter can also increase when pollutants contributed by roads and car activity in urban areas are washed into storm drains.
Landfill leachate is another problem. Municipal landfills contain all sorts of substances that release DOM as they break down and provide nutrient-rich environments for microbial activity. They also include plenty of organic pollutants from industrial and chemical materials. If landfill sites are not properly contained, FDOM can leach through soil into groundwater sources and enter surface water by subsurface pathways. And just like in urban and agricultural landscapes, heavy rains and floods can carry landfill runoff into surface waters. Finally, if landfills directly release leachate, treatment methods may not completely remove FDOM, leaving residual amounts to build up in natural water bodies.

Why measure FDOM?
Monitoring FDOM provides insight into carbon cycling through the biotic and abiotic components of a system. Natural processes and characteristics of water bodies influence the behavior of organic matter in a system; monitoring FDOM is broadly relevant to understanding nutrient cycling, patterns of biological activity, transport of organic matter between systems, and overall ecosystem productivity and health.
For more on the relationships between TOM, TOC, DOM, DOC, and FDOM, see “What is FDOM?”
Environmental Monitoring
Plant material (such as leaves, wood, and aquatic plants) releases DOC—namely, humic and fulvic acids—as it decomposes. DOC is a key component in nutrient cycling and influences water clarity, water quality, and the activity of microbes and other microorganisms. Monitoring FDOM helps identify humic and fulvic acids, contributing to an understanding of how DOC behaves in water systems.
Humic substances are problematic for water quality. Humics are chemically “sticky,” meaning that contaminants such as toxic metals easily form complexes with them. This allows humics to transport contaminants previously locked in soils into water bodies, where they become DOM. When this happens, aquatic life, humans and other organisms are more readily exposed to these toxic contaminants.
FDOM data can also point to increases in organic-rich waste from fish, invertebrates or other aquatic organisms. This nutrient buildup can provide early warning signs of spikes in microbial activity, harmful algal blooms, seasonal events like mass spawning or potential fish kills due to hypoxic conditions.
The life cycle of algal blooms produces DOM, and FDOM included under this category can indicate the onset or decay of algal blooms, as well as impacts on nutrient cycling due to bloom activity. Bacterial consumption of organic matter can also affect FDOM levels. Studying FDOM can reveal microbial activity dynamics, such as respiration and decomposition. Algal and bacterial activity can create dramatic fluctuations in FDOM levels, making FDOM an early warning system for eutrophication, hypoxia and harmful algal blooms (HABs). Since FDOM data can also help indicate the source of DOM, it can reveal whether blooms originated in situ or resulted from runoff carrying organic inputs from other areas.
Monitoring FDOM can help identify sources of organic matter—including sewage contamination, urban and agricultural runoff, and erosion—and track their impacts on natural water bodies. The composition and characteristics of organic matter can help determine whether runoff originated from agricultural sources like fertilizers and manure or from natural areas. Similarly, FDOM signatures can help identify sources of leaching. Tracking FDOM after storm events may indicate both the location and age of eroded soil entering water bodies. Analyzing FDOM data for leaching-related nutrient loss from soil can also inform water and soil quality management practices.
FDOM is relevant to environmental research focused on understanding marine carbon cycling. Wetlands and peatlands, which store large amounts of carbon, can export carbon into surrounding environments. Monitoring FDOM provides insight into seasonal fluctuations in these environments and how those fluctuations influence carbon cycling. FDOM data also helps examine DOM transformation processes and DOM’s impact on environmental water quality and oxygen levels. It contributes important data to our understanding of the effects of climate change on organic matter.

Water & Wastewater Treatment
Tracking changes in organic matter inputs to drinking water sources can inform treatment processes. Collecting baseline data on seasonal fluctuations in organic matter from source water can prepare drinking water plants to more efficiently address treatment needs. Additionally, source water monitoring can help identify potential spills or contamination events and more quickly reveal and address the presence of harmful algal blooms. It can also help predict the formation of disinfection byproducts within the treatment plant by providing a more detailed picture of water quality coming from lakes and reservoirs.
In addition to source water monitoring and understanding raw intake water quality, monitoring for FDOM in plant operations can help optimize treatment processes, improve the removal of organic matter and ensure regulatory compliance. Continuous monitoring of organic matter can inform real-time adjustments to chemical dosing and help limit the formation of disinfection byproducts (DBPs). Humics, in particular, react with chlorine during water treatment to form harmful DBPs that must be removed to protect human health.
Outside the plant, FDOM monitoring is important for detecting sewage contamination and identifying illicit discharges in storm sewers. Monitoring for FDOM at the point of effluent discharge can help assess treatment effectiveness for organic matter removal and guide operational improvements. FDOM data can also provide insights into how urban runoff entering treatment systems influences overall plant performance.

What methods are used to measure FDOM?
FDOM may be measured in the field or in a laboratory using fluorometers. Fluorometers are instruments designed to detect fluorescent molecules. These molecules absorb light, which “excites” electrons. The energy those electrons hold must either be passed on to another molecule or released as heat or light. Fluorometers detect the energy emitted as light.
The emitted light exists within a narrow range of wavelengths. For each fluorescent molecule, only a specific range of wavelengths can be absorbed; this is called the “excitation light.” The excitation light is a shorter wavelength and higher energy than the emission light, which will have longer wavelengths and lower energy. If you’re interested in understanding this better, you can learn more about the physics of fluorescence and the electromagnetic spectrum here.
These excitation and emission wavelengths facilitate detection of humic-like substances, which are usually the molecules of interest when monitoring FDOM in the environment. For more on the relevance of humics to FDOM monitoring, see "Why measure FDOM?”
Spectrofluorometers
Spectrofluorometers are benchtop instruments that take advantage of the principles of fluorescence.
In a spectrofluorometer, a water sample is placed in a special container called a cuvette. A light beam passes through a filter before reaching the cuvette. This filter narrows the range of wavelengths that reach the sample to include only those that excite the fluorescent molecules of interest (and potentially other fluorescent molecules present). All fluorescent molecules that absorb light in this range will emit light at longer, lower-energy wavelengths. A second filter, located on the other side of the cuvette, limits the light reaching the detector to those emission wavelengths that come from the target analyte.
The light source in a spectrofluorometer is typically a Xenon lamp, which produces intense light across a broad range of wavelengths. This high-intensity light allows the instrument to detect very low concentrations of the analyte but also requires a lot of power.
Due to their size and power demands, Xenon lamp-based spectrofluorometers are not practical for field use. Additionally, environmental monitoring typically does not require the high sensitivity these instruments provide. However, excitation-emission spectra of water samples gathered by spectrofluorometers are still valuable for research, especially in understanding DOM components. These are often used alongside in situ fluorometers in environmental studies.

Portable Fluorometers
By far the most common tools for monitoringFDOM in natural waters are portable fluorometers.
In contrast to a bulky, power-hungry Xenon lamp, these sensors use compact LED light sources that require far less power. These sensors can use an LED in conjunction with a filter or use a type of LED that can deliver light of around 365-370 nm. The excitationight is passed directly into the water through a specialized window of the sensor. The light emitted by the fluorescent molecules then passes back through that same sensor window to reach a detector within the sensor. The detector component is a photodiode that detects light of around 460-480 nm and converts that to an electrical signal the sensor can measure.

How do In-Situ sensors measure FDOM?
FDOM sensors are specialized fluorometers—optical instruments that measure fluorescence in substances, specifically dissolved organic matter in water. Many molecules can absorb light from a specific spectrum and then emit light at a different wavelength, a process known as fluorescence.
These fluorescent molecules are detected using a carefully designed system: an LED emitter generates light at a specific wavelength, and filters isolate the desired excitation spectrum. When this light reaches fluorescent molecules in a water sample, they absorb the energy and emit light at a longer wavelength (lower energy). This emitted light is known as the fluorescence signature.
The sensor’s detector, equipped with its own set of filters, captures this emitted light and measures its intensity. Because fluorescence intensity is proportional to the concentration of fluorescent molecules, the sensor can estimate the concentration of target substances in the water. As concentration increases, more molecules absorb the excitation light, typically resulting in stronger fluorescence.
Measurements are typically expressed in Relative Fluorescence Units (RFUs). RFUs indicate relative changes in concentration of the fluorescent substance, but they do not provide an exact concentration without calibration.
FDOM specifically refers to the subset of dissolved organic matter that fluoresces when excited by light in the 360–390 nm range. The detector in an FDOM sensor captures the emissions in the 460–530 nm range, providing valuable data about organic content in water systems.
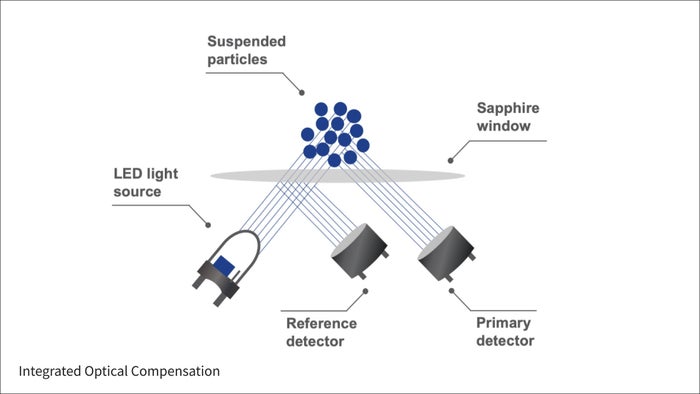
In-Situ fluorometers also include a reference detector for Integrated Optical Compensation. This reference detector measures changes in LED brightness and automatically adjusts each reading to compensate for variations caused by temperature or age of the sensor.

What are common challenges when monitoring FDOM?
Fouling
The most notorious challenge when monitoring FDOM in the field is fouling. When buildup blocks the sensor window, the sensor cannot transmit or receive light. Because light delivery and detection are essential to the sensor's functionality, any obstruction will interfere with data accuracy. To ensure reliable FDOM measurements, regular maintenance coupled with passive and mechanical antifouling tools is essential.
Temperature
For all fluorometers, there is an inverse relationship between fluorescence and temperature. This presents the greatest challenge at very low ranges of sensor detection. At these ranges, a change from 0.1 to 0.2 RFU, for instance, may look like an increase in FDOM, when it may actually represent a decrease in temperature while measuring in deeper waters or a temperature drop due to seasonal change. On-board temperature sensors can help with understanding the influence of temperature on FDOM measurements and enable temperature corrections. The importance and level of temperature’s effect on fluorescence is project specific and any corrections should be developed empirically on a project-by-project basis.
Turbidity
All optical sensors experience interference from turbidity. Storm events, high sediment loads and different types of water bodies can all increase turbidity and its effects on FDOM monitoring. High turbidity increases the chances that the wavelengths of light will not have a clear path to and from the sensor. Particulates in water can block the light that reaches fluorescent molecules and light emitted by the fluorescent molecules can similarly be blocked from reaching the sensor. Additionally, suspended particles provide surfaces where DOM can adsorb. This removes fluorescent compounds from the dissolved fraction and can change the fluorescent characteristics of the target molecules. Thus, the relationship between turbidity and FDOM is complex. It is not always linear and can be influenced by different particle types.
In all cases, however, turbidity is most likely to lead to an underestimation of FDOM. Best practice is to always measure turbidity alongside FDOM. At the very least, this enables an awareness of possible turbidity interference. In some cases, turbidity measurements can help develop a mathematical correction for turbidity interference. The threshold at which turbidity interference occurs, in either nephelometric turbidity units (NTUs) or formazin nephelometric units (FNU), depends on both the monitoring site and project objectives. Any turbidity corrections must be developed empirically from site-specific measurements.
Inner Filter Effects
The inner filter effect is a type of interference gaining interest in environmental monitoring. “Inner” refers to a light-filtering effect created by compounds contained within a sample. For example, if there is a very high concentration of DOM, molecules may absorb some of the excitation light, reducing the amount of light that reaches molecules deeper in the sample. Emitted fluorescence might also be absorbed by other fluorescent molecules in the water.
Both of these processes lead to a non-linear response and an underestimation of FDOM. The effect seems most severe in highly colored samples; having both a CDOM and an FDOM sensor together may be useful for these environments.
Another response to this challenge is to collect samples and dilute them, to see if there is a linear response with FDOM and concentration of the sample. As with temperature and turbidity, the objectives of the monitoring program must drive the decision of whether and how to address these interferences.
What makes In-Situ FDOM sensors unique?
Integrated Optical Compensation
Like all components, LED brightness in optical sensors will decrease over time with extended use. In-Situ FDOM sensors include a primary detector and secondary reference detector to measure LED drift and automatically compensate each reading. This feature enhances stability at very low detection limits and significantly reduces sensor drift caused by changes in temperature or time.
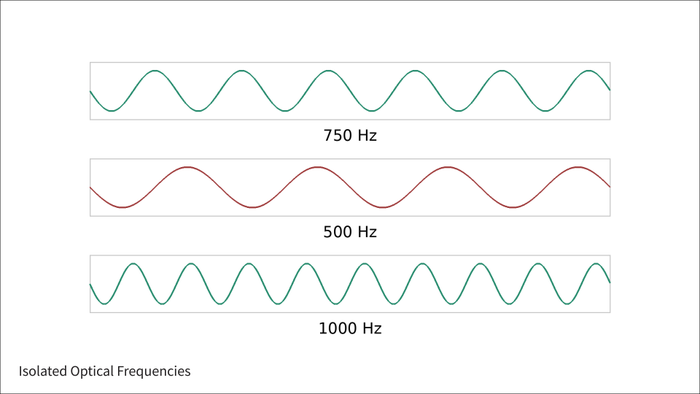
Isolated Optical Frequencies
In most water quality platforms, installing more than one optical sensor causes interference among sensors. Each In-Situ optical sensor runs at a unique frequency that creates a digital signature for each light source. Detectors for FDOM sensors use this signature to isolate FDOM wavelengths from other light sources and measure only the targeted parameter. This allows multiple optical sensors to run simultaneously in one instrument.
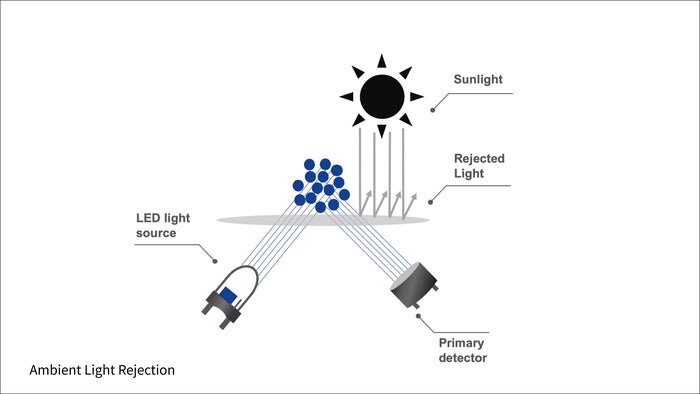
Ambient Light Rejection
Ambient light can interfere with optical measurements when sensors cannot distinguish between internal and external light sources. In-Situ FDOM sensors separate light from the sensor from other ambient light sources, enabling the same degree of accuracy regardless of lighting conditions or deployment location.
Low-Interference Spectral Bands
Interferences between sensors and inaccuracies in algae monitoring data are more likely to occur when fluorometers excite a wider range of wavelengths. In-Situ fluorometers include one parameter per sensor. Each sensor excites a small range of the light spectrum to increase accuracy while minimizing interference from other fluorescence sources.

Which FDOM sensor is right for your application?
 Aqua TROLL FDOM Sensor$1,995.00Pricing only valid in the U.K.Aqua TROLL sensor to use with Aqua TROLL 500 and 600 to monitor Fluorescent Dissolved Organic Matter (FDOM).
 Aqua TROLL FDOM Solid State RFU Calibrator$495.00Pricing only valid in the U.K.Stable and repeatable solid state standard for RFU calibration and checks on the Aqua TROLL FDOM sensor.
 Aqua TROLL 500 Multiparameter Sonde$0.00Pricing only valid in the U.K.A fully customizable five-port multiparameter sonde with capacity for four interchangeable sensors and an antifouling wiper. A smartphone interface delivers accurate data and enables simplified calibration, panoramic data view and report creation. Ideal for spot-checking and profiling applications when used with a TROLL Com Plus or for long-term monitoring with VuLink telemetry.
 Aqua TROLL 600 Multiparameter Sonde$4,295.00Pricing only valid in the U.K.
A fully customizable multiparameter sonde with interchangeable sensors, long-lasting battery power, and a smartphone interface that delivers accurate data and enables simplified calibration, panoramic data view and report creation. Ideal for short-term and long-term deployment. Available in vented and non-vented options.
 Aqua TROLL 700 Multiparameter Sonde$4,220.00Pricing only valid in the U.K.
A fully customizable multiparameter sonde with interchangeable sensors, long-lasting battery power, and a smartphone interface that delivers accurate data and enables simplified calibration, panoramic data view and report creation. Ideal for short-term and long-term deployment. Available in vented and non-vented options.
 Aqua TROLL 800 Multiparameter Sonde$6,330.00Pricing only valid in the U.K.A fully customizable seven-port multiparameter sonde with capacity for six interchangeable sensors and an antifouling wiper. A smartphone interface delivers accurate data and enables simplified calibration, panoramic data view and report creation. Ideal for short-term and long-term deployment. Available in vented and non-vented options.
Additional Resources
- News Top Five Items for an Algae-Monitoring Cleaning Kit
- News New Patented Fluorometer Technology Improves Detection of Harmful Algal Blooms and Tracer Studies
- News In-Situ Brings Patented Tech to New Fluorometers — Interview with Product Manager Steve Sewell
- News Adding Sensors to the "Big 5" Can Tell the Whole Story