Purge Volumes in Groundwater Sampling – Part 2
Differences Between Purge Volume Calculations
In Peter Dumble’s blog (Part 1), he presented some notes on purge volume methods and indicated those which are supported by science and those which are included in guidance.
In this blog, Dumble takes a hard look at the purge volume numbers and the differences between the methods and try to understand how these differences have come about.
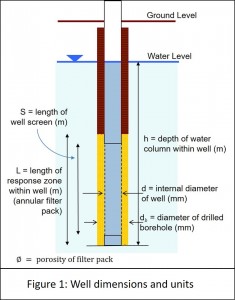
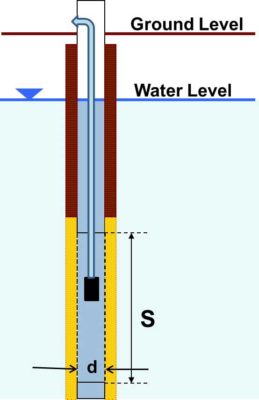
The four different approaches to calculating purge volumes are summarized here. Well dimensions and units used in the equations below are shown in Figure 1. In all cases the removal of 3 to 5 times the well volume is usually specified, with most practitioners using 3 x well volume as a default target.
Method 1: Standard Well Volume Calculation

Method 2: Standard Well Volume Calculation Plus Annular Filter Pack

Method 3: Sample Zone Volume Calculation

Method 4: Screen Volume Calculation

Purge Volume Comparisons
To demonstrate the different purge volumes calculated by each method, six different borehole / well construction scenarios are modeled below. The purge volumes calculated are then illustrated graphically to allow a visual comparison between methods and from which you can make your own conclusions.
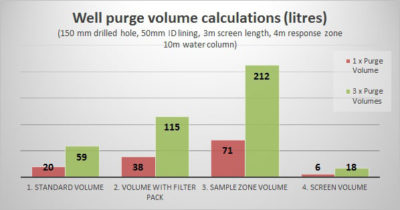
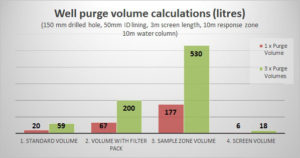
Model 1: A typical shallow monitoring borehole
- 150 mm diameter drilled borehole
- 50 mm diameter x 3m long well screen
- 4 m annular response zone (filter pack)
- 10 m water column (measured from the base of the well lining)

In this case, the Sample Zone Purge Volume is 3 times the Standard Volume and 9 times greater than the Screen Volume. These are manageable quantities of water.
Model 2: A typical shallow monitoring borehole with long response zone
- 150 mm diameter drilled borehole
- 50 mm diameter x 3m long well screen
- 10 m annular response zone (filter pack)
- 10 m water column (measured from the base of the well lining)

In this case, the Sample Zone Purge Volume is 9 times the Standard Volume and 30 times greater than the Screen Volume. Removing and safely disposing of 530 m3 of purge water, particularly if contaminated is verging on being impractical.
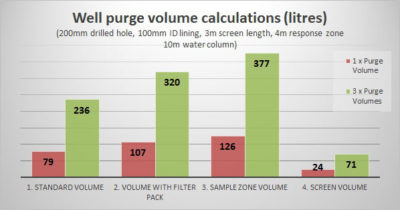
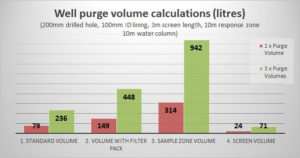
Model 3: A larger diameter shallow monitoring borehole
- 200 mm diameter drilled borehole
- 100 mm diameter x 3m long well screen
- 4 m annular response zone (filter pack)
- 10 m water column (measured from the base of the well lining)

In this case, the Sample Zone Purge Volume is 1.6 times the Standard Volume and 5 times greater than the Screen Volume. These volumes are looking difficult. The option of using the screen volume is attractive.
Model 4: A larger diameter shallow monitoring borehole with long response zone
- 200 mm diameter drilled borehole
- 100 mm diameter x 3m long well screen
- 10 m annular response zone (filter pack)
- 10 m water column (measured from the base of the well lining)

In this case, the Sample Zone Purge Volume is 4 times the Standard Volume and 13 times greater than the Screen Volume – and impractical to manage in most circumstances.
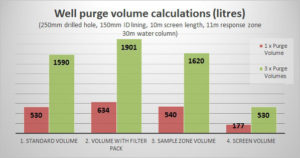
Model 5: A deeper, larger diameter well in a major aquifer

In this case, the purge volumes for the first 3 methods are in the same order of magnitude – and require removal of 1.5 to nearly 2 m3 of water. Even the Screen Volume looks daunting.
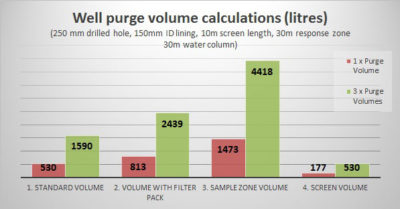
Model 6: A deeper, larger diameter well in a major aquifer with long response zone
- 250 mm diameter drilled borehole
- 150 mm diameter x 10m long well screen
- 30 m annular response zone (filter pack)
- 30 m water column (measured from the base of the well lining)

In this case, the Sample Zone Purge Volume at 4 m3 is 3 times the Standard Volume and 8 times greater than the Screen Volume. These volumes are very difficult to manage.
Why Purge so Much?
As diameters get larger the purge volumes generated increase significantly. In larger diameter wells in which the response zone is similar in length to the screened interval, the first three methods begin to produce similar well volumes (Model Scenario 5). Perhaps, the origin of the sample zone method comes from experience with monitoring of deep aquifers using large pumps? It certainly makes no sense for those of you working with small diameter monitoring boreholes to use the sample zone volume as it is significantly greater than any other method. However, this is the method stated in the current ISO / British Standard and the Nuclear Industry code of practice. There seems to have been little thought given to the practical impact of imposing this purge volume calculation method, particularly when there is ample scientific justification to support less onerous purge volume criteria.
The “Screen Volume” is interesting and potentially offers a scientifically defensible alternative to other purge methods. It has not yet been adopted within any guidance documents – perhaps it’s time to think again?
For more articles by Peter Dumble, please visit his blog on In-Situ Europe’s website.
Peter Dumble is an Independent Hydrogeologist based near Tiverton in Devon.
Differences Between Purge Volume Calculations
In Peter Dumble’s blog (Part 1), he presented some notes on purge volume methods and indicated those which are supported by science and those which are included in guidance.
In this blog, Dumble takes a hard look at the purge volume numbers and the differences between the methods and try to understand how these differences have come about.
The four different approaches to calculating purge volumes are summarized here. Well dimensions and units used in the equations below are shown in Figure 1. In all cases the removal of 3 to 5 times the well volume is usually specified, with most practitioners using 3 x well volume as a default target.
Method 1: Standard Well Volume Calculation
Method 2: Standard Well Volume Calculation Plus Annular Filter Pack

Method 3: Sample Zone Volume Calculation
Method 4: Screen Volume Calculation

Purge Volume Comparisons
To demonstrate the different purge volumes calculated by each method, six different borehole / well construction scenarios are modeled below. The purge volumes calculated are then illustrated graphically to allow a visual comparison between methods and from which you can make your own conclusions.
Model 1: A typical shallow monitoring borehole
- 150 mm diameter drilled borehole
- 50 mm diameter x 3m long well screen
- 4 m annular response zone (filter pack)
- 10 m water column (measured from the base of the well lining)
In this case, the Sample Zone Purge Volume is 3 times the Standard Volume and 9 times greater than the Screen Volume. These are manageable quantities of water.
Model 2: A typical shallow monitoring borehole with long response zone
- 150 mm diameter drilled borehole
- 50 mm diameter x 3m long well screen
- 10 m annular response zone (filter pack)
- 10 m water column (measured from the base of the well lining)
In this case, the Sample Zone Purge Volume is 9 times the Standard Volume and 30 times greater than the Screen Volume. Removing and safely disposing of 530 m3 of purge water, particularly if contaminated is verging on being impractical.
Model 3: A larger diameter shallow monitoring borehole
- 200 mm diameter drilled borehole
- 100 mm diameter x 3m long well screen
- 4 m annular response zone (filter pack)
- 10 m water column (measured from the base of the well lining)

In this case, the Sample Zone Purge Volume is 1.6 times the Standard Volume and 5 times greater than the Screen Volume. These volumes are looking difficult. The option of using the screen volume is attractive.
Model 4: A larger diameter shallow monitoring borehole with long response zone
- 200 mm diameter drilled borehole
- 100 mm diameter x 3m long well screen
- 10 m annular response zone (filter pack)
- 10 m water column (measured from the base of the well lining)
In this case, the Sample Zone Purge Volume is 4 times the Standard Volume and 13 times greater than the Screen Volume – and impractical to manage in most circumstances.
Model 5: A deeper, larger diameter well in a major aquifer
In this case, the purge volumes for the first 3 methods are in the same order of magnitude – and require removal of 1.5 to nearly 2 m3 of water. Even the Screen Volume looks daunting.
Model 6: A deeper, larger diameter well in a major aquifer with long response zone
- 250 mm diameter drilled borehole
- 150 mm diameter x 10m long well screen
- 30 m annular response zone (filter pack)
- 30 m water column (measured from the base of the well lining)
In this case, the Sample Zone Purge Volume at 4 m3 is 3 times the Standard Volume and 8 times greater than the Screen Volume. These volumes are very difficult to manage.
Why Purge so Much?
As diameters get larger the purge volumes generated increase significantly. In larger diameter wells in which the response zone is similar in length to the screened interval, the first three methods begin to produce similar well volumes (Model Scenario 5). Perhaps, the origin of the sample zone method comes from experience with monitoring of deep aquifers using large pumps? It certainly makes no sense for those of you working with small diameter monitoring boreholes to use the sample zone volume as it is significantly greater than any other method. However, this is the method stated in the current ISO / British Standard and the Nuclear Industry code of practice. There seems to have been little thought given to the practical impact of imposing this purge volume calculation method, particularly when there is ample scientific justification to support less onerous purge volume criteria.
The “Screen Volume” is interesting and potentially offers a scientifically defensible alternative to other purge methods. It has not yet been adopted within any guidance documents – perhaps it’s time to think again?
For more articles by Peter Dumble, please visit his blog on In-Situ Europe’s website.
Peter Dumble is an Independent Hydrogeologist based near Tiverton in Devon.