Topics Covered
- What is turbidity?
- What creates turbidity in water?
- Why measure turbidity?
- What methods are used to measure turbidity?
- What are common types of optical turbidity sensors?
- EPA 180.1 vs. ISO 7027: Turbidity Measurement Differences
- What units are used to measure turbidity?
- What is the difference between measuring turbidity and measuring suspended solids?
- What are common challenges when monitoring turbidity?
- How do In-Situ’s sensors measure turbidity?
- What makes In-Situ’s turbidity sensors unique?
- Which turbidity sensor is right for your application?
- Additional Resources
What is turbidity?
Turbidity represents the relative clarity or transparency of a body of water or other liquid. Water bodies with low turbidity are clear and easy to see through, while highly turbid waters will appear murky, cloudy or opaque. This haziness is created when particles present in the water cause light to be scattered in a solution. These particles can include sediment, soil, organic material, contaminants and microorganisms, among others. It is important to note that turbidity is not a direct measure of the quantity of suspended solids in a sample; it is only a measure of how much those particles scatter light. You can read more about the difference between turbidity and TSS here.
What creates turbidity in water?
Turbidity is created when particles become suspended in water. Changes in turbidity can be traced back to different causes depending on the type and location of a water body.
For surface water environments, a higher volume of flow–often due to natural causes–is the most common source of turbidity. When storms, melting snow and other natural events lead to higher volumes of flow, channels and banks erode more easily, increasing turbidity in rivers and lakes. Flow can also carry silt, storm debris and disturbed particles from other locations through riverbeds and streams and out to lakes or estuaries.
Human activity and industrial operations can also contribute to increased turbidity. Mining, construction projects, dredging, logging and other industrial operations can erode or disturb soil and sediment, sending particles into nearby water bodies. And when not managed properly, effluent discharge from wastewater treatment plants and agricultural runoff can also carry suspended solids and particulates into rivers and lakes.
Activity on the surface, whether natural or manmade, can cause turbidity to increase in groundwater sources. Disturbances such as earthquakes, vibrations, drilling or blasting can change the flow or behavior of aquifers and cause turbidity to rise. Similarly, pumping, purging or injection change the direction and rate of aquifer flow, temporarily altering turbidity levels.
Aquatic life can also raise turbidity levels during periods of heightened activity. In oceans, wetlands and lakes, algal blooms can create dramatic changes in turbidity throughout their life cycle. If hypoxia occurs, particles contributed by dead and decaying organisms will make waters much hazier. And while much smaller in scale, the movements of fish and other aquatic life can agitate sediment and affect turbidity readings, though this is likely to be isolated to a specific location and time and not a prolonged source of changes in turbidity.

Why measure turbidity?
Turbidity is an important parameter for both environmental monitoring and water treatment processes. While turbidity itself is not a health risk, it can point to issues with water quality for humans, animals and environments. An increase in turbidity can indicate that surface water, coastal and groundwater ecosystems have been disturbed by human activity or natural phenomenon. Drinking water and wastewater treatment facilities monitor turbidity entering a plant to assess how much chemical dosage is necessary to maintain optimal residuals. Strict turbidity standards ensure drinking water and effluent is safe for consumption and release, and facilities monitor post-process turbidity levels to verify equipment and treatment stages are performing as intended.
Surface Water & Coastal
Turbidity can occur naturally in surface water, as sand, clay, silt and other organic matter can enter a water body through erosion or seasonal changes in flow. It’s important to monitor baseline values of turbidity to establish what the natural variation is for the area and compare these trends to effects of stormwater runoff, droughts, effluent discharge and other significant events.

Monitoring turbidity helps tell the story of activity in the area–whether natural or manmade–and how it impacts environments and communities. Natural events such as heavy rains, melting snow and runoff can displace sediment, potentially harming water quality. Additionally, operations such as construction, agriculture, mining, logging and dredging can generate pollutants or disturb sediment and harm surrounding environments if not carefully managed. And when floods or stormwater runoff pass through industrial areas, they can carry contaminants from these operations into natural water sources. Increased turbidity also plays a big role in whether water bodies are suitable for recreational purposes; people generally don’t want to swim, boat or fish in areas with cloudy water.
But turbidity is not just an aesthetic concern. Changes in turbidity in lakes, rivers, wetlands and other environments are an important indicator of water quality and an important factor for the health of plant and animal life. High turbidity can decrease the amount of sunlight able to pass through the water to plants, decreasing photosynthesis and creating a ripple effect that will impact the rest of the food chain.

Turbidity also plays an important role in source water monitoring. Increased turbidity in a drinking water reservoir needs to be carefully monitored for contaminants so operators can adjust the process to account for higher levels of bacteria, sediment and metals or nutrients. Harmful algal blooms are also a concern when monitoring source water, as an overabundance of algae in reservoirs can dramatically change the quality of water entering a plant.
Environmental monitoring stations are often set up downstream of effluent release to study the impact of the wastewater treatment process on surface water. Monitoring turbidity near where effluent meets a natural water body helps verify that the treatment process has been effective and effluent discharge meets or exceeds the quality of pre-existing conditions. In coastal monitoring, turbidity is more often created by an abundance of organic matter, such as plankton or algae. Plankton is the most common source of turbidity in the ocean, and many scientists monitor for turbidity to assess the availability of plankton as a food source for other creatures. Dredging operations can also increase turbidity in coastal environments. Turbidity must be closely monitored during dredging to assess and minimize impacts on aquatic life and ecosystem health.
Monitoring for turbidity during and after storm events helps coastal communities stay informed and accurately assess erosion risks. Beaches that lose too much sand are more vulnerable to hurricanes, flooding and other natural disasters. Environmental scientists and aquaculturists in coastal areas also keep a close eye on turbidity as an indicator of runoff from surface water sources, to identify and mitigate the impact of any bacteria, nutrients or sediment that accompany them.

Groundwater
Turbidity in groundwater is typically quite low, less than 1 NTU/FNU if the system is not disturbed. Because of this low baseline, turbidity higher than 1 NTU/FNU in groundwater often indicates that an event on the surface is affecting the aquifer. Impacts from drilling and blasting, earthquakes or surface water infiltration can all raise turbidity levels in groundwater.
The other cause of increased turbidity in groundwater are changes in flow rates, gradients or direction of flow. These changes can result from pumping, injection or purging before collecting groundwater samples.
Turbidity is often measured during a well purge to indicate when conditions have stabilized enough to begin sampling. Turbidity spikes when pumping begins; a stabilized turbidity value indicates the well screen is fully purged and water quality is representative of the surrounding aquifer.

Water & Wastewater Treatment

Customers want clear drinking water, but the role of turbidity in the water treatment process goes beyond aesthetic expectations. Microbes, bacteria and other pollutants can attach to particles suspended in water. This connection makes them more difficult to remove and can complicate the disinfection process, leading to greater health risks. For example, in the United States, plants that source drinking water from surface water are required to monitor turbidity during the process and maintain a value below 1 NTU in finished water. Many plants also monitor source water for turbidity before treatment begins, to more effectively identify and address levels of bacteria, sediment, metals or nutrients entering the plant.
Monitoring turbidity during the drinking water treatment process can provide a benchmark of a filter’s effectiveness and indicate when it might need to be replaced. And high turbidity can point to pipe damage or other issues with infrastructure in a distribution system.
Wastewater applications more commonly measure total suspended solids (TSS) or mixed liquor suspended solids (MLSS) rather than turbidity. TSS plays an essential role in managing the activated sludge process, as the right level of TSS helps create a positive environment for microbes to consume and break down waste while avoiding system overload. TSS is also important in managing the sludge/water interface to detect a rising sludge blanket and monitor settling characteristics of the sludge.
That said, turbidity is a good indicator of process performance and monitoring turbidity at the point of effluent helps identify if adjustments are needed. If high turbidity is observed, it can indicate problems with the settlement process, floating sludge or sludge blanket overflow, over- or under-dosing of chemicals or high flows affecting the treatment process.
For more on the difference between turbidity and TSS, visit "What is the difference between measuring turbidity and measuring suspended solids?"

What methods are used to measure turbidity?
Secchi Disk
Measuring turbidity with a Secchi disk involves lowering a disk into a water body. The disk is attached to a line marked with depth measurements. The operator lowers the disk until it disappears and notes the depth marked on the line. This depth (known as the “Secchi depth”) is then recorded. The Secchi depth is inversely related to turbidity; clear water will have a high Secchi depth, while turbid water will have a low Secchi depth.
While Secchi disks are a low-cost, easy-to-use method, they work only in deep water, where the disk is not visible along the bottom of the water body. They’re also more susceptible to the effects of variable conditions like light, waves and obstructions in the water, and are vulnerable to human error. Ideally, turbidity readings taken with a Secchi disk should be collected at the same time each day by the same person each time to eliminate variations in eyesight and height.

Jackson Candle Method
The Jackson Candle Method is one of the earliest methods of measuring turbidity. Turbidity is calculated by observing a candle flame through a glass tube of water, adding water to the tube until the flame is no longer visible. If only a little water obscures the flame, the sample is high in turbidity. If a lot of water is needed, the sample is clearer. The Jackson Candle Method is easy to set up and use but can result in inconsistencies in measurement with different operators.
Turbidity Tube
The turbidity tube (sometimes known as a transparency tube) was invented in Australia in the 1990s to allow for turbidity measurement in shallow streams where Secchi disks were ineffective. Turbidity tubes are plastic tubes approximately 100 cm tall with a miniature Secchi disk printed on the bottom. The tube is filled with water. If the Secchi disk is not visible, the operator presses a release valve near the bottom of the tube to slowly let out water until they can see the disk. They record the value printed on the side of the tube at this depth. Often, operators will take two measurements with a turbidity tube and average the depths to arrive at the most probable measurement. Depths are then correlated to NTU values using a table produced by the tube’s manufacturer.
Turbidity tubes are easy to use and can be transported to the field to avoid time delays for lab sample analysis. Tubes also come pre-calibrated, so turbidity correlations are easy to calculate. But, like the Secchi disk and Jackson Candle Method, readings can be affected by factors like operators’ eyesight, human error and environmental conditions.
Optical Sensors
Optical sensors come in benchtop units (spectrophotometers) or portable probes for field measurement (turbidimeters). Unlike Secchi disks, the Jackson Candle Method and turbidity tubes, optical sensors present consistent values no matter who uses them.
Optical sensors automatically calculate turbidity values based on the difference in emitted light and detected light. All optical turbidity sensors contain a light source to emit light and a photodetector, which receives that light and calculates a turbidity value based on the calibration of the sensor.
There are two methods optical sensors use to measure the difference between emitted and detected light. Some optical sensors calculate this difference based on how light scatters when it comes into contact with particles in the sample. Other optical sensors calculate the difference based on how much the emitted light diminishes between the light source and the photodetector.
Three other components further differentiate methods of optical turbidity measurement: the type of light emitted into the sample (white light or LED), the number of photodetectors present and the angle at which the photodetector(s) are positioned in relation to the light source.
For more detail on the types of optical turbidity sensors, their methods and components, see “What are common types of optical turbidity sensors?”

Acoustic Doppler Meters
Acoustic doppler meters are an established method of flow measurement. Recent research has introduced their potential for monitoring turbidity as well, by using acoustic velocity backscatter data to derive suspended sediment values. This method of measurement is similar to optical sensors, but with sound. Sound waves also scatter when they encounter particles in a water sample. Just like optical sensors include a photodetector to calculate turbidity based on the ratio of returned light to emitted light, acoustic doppler meters include a transducer that calculates turbidity based on the ratio of returned sound frequencies to emitted sound frequencies. However, acoustic doppler meters are not a direct measurement of turbidity and require correction for absorption and diffusion of sound waves across distance.
For a detailed look at this method of measurement, read the “Sediment and Erosion Techniques” chapter from the USGS’ Application of Hydraulics.
What are common types of optical turbidity sensors?
Turbidimeters
Turbidimeters are optical turbidity sensors typically employed more often in the field than the lab. There are three kinds of turbidimeters: nephelometers, attenuation sensors and backscatter sensors. They’re differentiated based on how many photodetectors they contain and the angle at which photodetectors are placed in relation to the light source.
Nephelometers
Nephelometers measure the intensity of scattered light at a 90 degree angle, with a photodetector located perpendicular to the light source. Nephelometers are designed to use either the ISO 7027 method or the EPA 180.1 method. A sensor that uses the ISO 7027 method includes an LED light source, while sensors that use the EPA 180.1 method contain a white light source. Once the photodetector receives light scattered by the particles, the sensor calculates a turbidity value in Nephelometric Turbidity Units (NTU) or Formazin Nephelometric Units (FNU). FNU is usually selected if the sensor has been calibrated with Formazin turbidity standard.
Attenuation
Attenuation sensors measure the intensity of scattered light through attenuation, or absorption. The photodetector is located directly across from the light source, with the sample between them. Light is diminished as it passes through the sample; the photodetector measures the amount of light that reaches it. This measurement will vary with turbidity levels–as turbidity increases, less of the emitted light will reach the photodetector. This configuration on its own will not be able to measure very large ranges of turbidity, so attenuation sensors often contain a secondary forward scatter detector as well. This photodetector is located 11 to 30 degrees from the first photodetector to increase the range and accuracy of turbidity measurements. Due to this configuration, these sensors are sometimes referred to as forward scatter sensors.
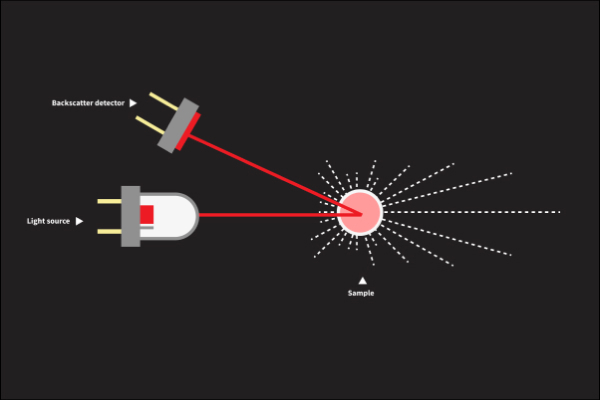
Backscatter sensors
Backscatter sensors are most commonly used to measure high levels of turbidity. They feature a backscatter photodetector positioned within 20 degrees of the light source. It’s possible that a sample could contain enough particulate matter to completely obscure the light source in a traditional nephelometer configuration. By positioning the photodetector so close to the light source, backscatter sensors limit the path length the light has to travel, enabling an accurate measurement even when turbidity levels are very high. Backscatter sensors measure turbidity in Backscatter Units (BU) or Formazin Backscatter Units (FBU).
Spectrophotometers
Spectrophotometers are optical benchtop devices for determining the turbidity of a sample in a lab environment. Just like turbidimeters, spectrophotometers use a variety of methods for measuring turbidity (including the EPA 180.1 method and the ISO 7027 method) and can be designed as nephelometers or attenuation sensors.

What are the differences between EPA 180.1 and ISO 7027 measurement methods?
There are two main methods that optical sensors use for turbidity measurement: EPA 180.1 and ISO 7027.
A sensor that uses the ISO 7027 method includes a light source with a wavelength of 830 to 890 nanometers. Sensors that use the EPA 180.1 method contain a white light source. Photodetectors measure LED light in wavelength while white light is measured in color temperature. Both methods specify that the photodetector should be located at a 90 degree angle in relation to the light source.
EPA 180.1 is the standard approved by the United States Environmental Protection Agency for monitoring turbidity in drinking water treatment. Because of its use in this application, it is more likely to appear in benchtop units, as drinking water treatment does not frequently require portable monitoring devices. Field instrumentation for environmental monitoring is more likely to use the ISO 7027 method, especially for continuous deployments.
What units are used to measure turbidity?
Turbidity values detected with different methods of measurement are not necessarily analogous as instrument design will affect measurement values. For example, the wavelength of emitted light and angle between the light source and photodetector will influence optical sensor measurements. Other monitoring techniques like Secchi disks or the Jackson Candle Method will be measured in entirely different units, as the determined value depends on the operator’s sight rather than a photodetector to produce a value.
For a more detailed overview of turbidity methods, see “What methods are used to measure turbidity?”
| Methods | Units |
|---|---|
| Secchi Disk | Secchi depth, length (meters, feet) |
| Jackson Candle Method | Jackson Turbidity Units (JTU) |
| Turbidity Tube or Transparency Tube | cm or inches, later correlated to NTU based on table accompanying device |
| Backscatter Sensors | Backscatter Units (BU), Formazin Backscatter Units (FBU) |
| Attenuation Sensors | Attenuation Turbidity Units (ATU), Formazin Attenuation Units (FAU) |
| Nephelometers | Nephelometric Turbidity Units (NTU), Formazin Nephelometric Units (FNU), Formazin Turbidity Units (FTU) |
NTU and FNU are considered numerically equivalent for sensors that use the ISO 7027 method of measurement. These nephelometers often provide the option to select either unit.
For a comparison of optical probe units accounting for wavelength of light source and detector geometry, reference “Turbidity Units of Measurement” from the USGS Oregon Water Science Center. For even more detail on turbidity measurement, reference Chapter A6 Section 6.7, “Turbidity,” of the USGS National Field Manual.
What is the difference between measuring turbidity and measuring suspended solids?
Turbidity and total suspended solids (TSS) measurements are related, but the two are measured using different processes and cannot be used interchangeably. Suspended solids are measured by mass and recorded in milligrams per liter (mg/L). Turbidity, by contrast, is not a measure of the mass or quantity of particles in a sample, but of their ability to scatter light. It is an optical measurement of how cloudy or hazy the water is based on how these particles alter the passage of light through the water.
For example, picture a glass of milk. Milk is very cloudy, making it highly turbid, but if you were to extract and weigh the milk solids in the glass, you would get a low weight of solids per liter of milk, meaning the glass of milk is high in turbidity but low in TSS. On the other hand, effluent from a gravel quarry contains a high weight of solids per liter of water, and therefore would have a high TSS value. But, if the gravel chunks are quite large, the water might be less cloudy than if the particles were smaller. It would therefore be lower in turbidity than in TSS.
So, while TSS includes many of the materials that contribute to turbidity in the water column, such as sediment, clay, algae and other organic and inorganic materials, these suspended particles can differ in size and composition, giving two solutions with the same TSS value very different turbidities.
But, while the measurements represent different qualities of a water sample, turbidity and TSS are still related. Higher TSS does mean there are more particles to scatter light, so turbidity values are often (but not always!) higher when TSS measurements are high. Turbidity, therefore, can provide a reasonable estimate of total suspended solids or sediments in a water body, but it must be correlated on a site-specific basis. And though a good tool for estimating TSS, turbidity values do not represent the amount of TSS at the site.

What are common challenges when monitoring turbidity?
Monitoring turbidity can be challenging. Below are some common factors that can affect accurate data collection.
Environmental Disturbances
Turbidity can appear more erratic than other parameters on graphs, but spikes in readings don’t necessarily mean a sensor is providing incorrect data. Environmental disturbances–such as an animal crossing a stream near the turbidity sensor–can cause turbulence or create aeration near the sensor, affecting the way light passes through the water, and therefore the sensor’s calculation of turbidity values.
This might show up as a sudden, dramatic spike in the data. While a spike like this isn’t necessarily inaccurate if sediment has been disturbed near the sensor, it also isn’t representative of turbidity across the water body. Occurrences like these can make it difficult to determine which turbidity values are representative of a site.
Because of how dramatically turbidity can vary during a set interval, it’s important to select sensors that record point data rather than sensors that integrate or average data across the reporting interval. Having access to point data provides users with a true picture of site conditions at the exact time of data logged and allows them to observe variation in data points across the reporting interval to account for environmental disturbances.

Fouling
As with any monitoring environment, fouling can create false readings if allowed to interfere with monitoring equipment. Heavy flow can carry sediment into sonde pipes, where it can settle around equipment. It’s important to drill holes to allow passage of sediment through the pipe to avoid sensor drift. This type of fouling can be a bigger challenge with turbidity than with other parameters, as turbidity is often measured in areas with high sediment loads and variable flow. In-Situ multiparameter instruments include an antifouling wiper that keeps sensor faces clear and removes sediment from the instrument end cap to keep fouling to a minimum.

Drift
LED brightness is affected by temperature and can change with age. If the photodetector in an optical sensor isn’t accounting for these influences, sensor readings may appear to drift. In-Situ's turbidity sensors include a reference detector that monitors any change in the LED's output, enabling the sensor to correct for these changes. This integrated optical compensation ensures sensor readings remain accurate across temperatures and over time.

Ambient Light
Optical turbidity sensors may be affected by external light. Sunlight will also scatter off particles in the water. If photodetectors pick up on these additional reflections, the resulting turbidity values may be inaccurate. In-Situ’s turbidity sensors are designed to separate the light from the LED from other ambient light sources to eliminate this issue.

Temperature
Temperature affects the brightness of LEDs. If the sensor does not compensate for temperature, this may show up like drift. All In-Situ turbidity sensors include internal temperature compensation to account for this influence.

Calibration Standards
Significant variation between calibration solutions made by different manufacturers leads to confusion and frustration around the perceived accuracy of sensors. It’s typical for manufacturers to perform calibration on water quality sensors to ensure accuracy across their full range. In-Situ’s 3D factory calibration not only ensures linear data but also reduces the number of calibration points the user is required to perform.
If user calibration involves standards from a different source, it could interfere with the accuracy of factory-calibrated sensors. For best results, always use calibration standards approved by the sensor’s manufacturer. In-Situ calibration solutions have been validated in a lab to ensure In-Situ’s water quality sensors will perform consistently across factory and user calibrations.

How do In-Situ’s sensors measure turbidity?
Environmental
In-Situ’s Aqua TROLL turbidity sensors are nephelometers that use the ISO 7027 method to measure turbidity. This method relies on an infrared LED to emit light, with the photodetector positioned at a 90 degree angle. ISO 7027 defines NTU and FNU as numerically equivalent and can report values in both units.
To actively quantify turbidity, light scattered by the sample must be compared to the light scattered by a known reference solution. In-Situ’s turbidity standards are specifically designed for In-Situ’s sensors to ensure accurate turbidity measurements.

Process
In-Situ’s TurbiTech Suspended Solids and Turbidity Sensors are designed to measure turbidity, total suspended solids (TSS) and mixed liquor suspended solids (MLSS) in influent, effluent, settlement tanks and activated sludge stages of the water or wastewater treatment treatment process.

The TurbiTech LS sensor uses the ISO 7027 method with a 90 degree photodetector angle and an 860 nm infrared beam. It is designed for use in wastewater treatment.
The TurbiTech D-ISO Sensor is specifically designed to monitor final treated, potable and filter water. This sensor also uses ISO 7027 to detect turbidity. With a flow-through cell designed to capture stray light, this turbidity sensor ensures a stable zero point. Its highly-sensitive photodetector can measure changes in turbidity of less than 0.01 NTU.

SoliTech IR Sensors can measure turbidity, suspended solids or sludge density, including sludge blanket detection. They can be installed as fixed sensors or used with a portable handheld to take spot samples. SoliTech Sensors monitor the attenuation of infrared light across a gap between light emitter and detector to determine the turbidity or suspended solids in the desired units. Unit options include mg/l, NTU, FTU, FNU and FAU. Four ranges to choose from maximize accuracy in a variety of applications.
What makes In-Situ’s turbidity sensors unique?
Integrated Optical Compensation
In-Situ’s turbidity sensors include integrated optical compensation to correct for drift over time and prevent inconsistencies between calibration in the lab versus the field. To accomplish this, In-Situ’s turbidity sensors contain two photodetectors. The primary detector measures the initial output of emitted light into the sample. The second (reference) photodetector measures the scattered light after the LED encounters particles in the sample. The sensor evaluates the light measured by the reference detector to determine if the output of the LED has changed. This allows the sensor to automatically correct the primary measurement for those changes. Integrated optical compensation provides stability at much lower limits of turbidity and significantly reduces sensor drift over temperature and time.

Ambient Light Rejection
Ambient Light Rejection separates the light from the sensor from other ambient light sources to prevent external light from entering optical sensor detectors and affecting their readings. This enables the same degree of accuracy regardless of lighting conditions or deployment location.

Isolated Optical Frequencies
If not accounted for, installing more than one optical sensor in a multiparameter platform can lead to interference between sensors. Aqua TROLL turbidity sensors run at a unique frequency from In-Situ’s other optical sensors. This allows the photodetector within the turbidity sensor to isolate its light source, allowing many optical sensors to run simultaneously.

3D Factory Calibration
In-Situ performs a 6-point factory calibration on every sensor. This ensures the sensor is linear across its full range (0-4,000 NTU) and reduces the number of required user calibration points to streamline setup and deployment.

Mini Calibration Cup
The Aqua TROLL multiparameter platform is designed with a restrictor that, when reversed, serves as a calibration cup. When calibrated as part of the five-port platform, the Aqua TROLL turbidity sensor requires only 50 mL of solution for both cleaning and calibration, saving up to five times the cost of turbidity standard compared to traditional calibration methods. When used as part of the seven-port platform, the calibration cup holds 200 mL of solution for all six sensors, saving up to three times the cost of turbidity standard.

Point Data
Sensors that integrate data points before outputting a value can simplify the variability of a parameter across time. It’s possible that, during a 15-minute interval, water quality in a riverbed may go from relatively clear to highly turbid (if, for example, an animal or other disturbance dislodges sediment). A sensor that processes or averages these discrete data points before output obscures this variation, leading to uncertainty around whether the value for this interval presents a true picture of site conditions at the moment of reporting. Point data allows the user the flexibility to perform any post-processing they desire without the risk of compounding uncertainty due to unknown or unwanted integrated data processing from the sensor.
Integrated Self-Cleaning
In-Situ’s Aqua TROLL multiparameter sondes are designed to accommodate an optional antifouling wiper, reducing maintenance and extending the interval between field visits. The dual-sided wiper brush simultaneously clears fouling from the sensor faces and the inside of the restrictor end cap. The Aqua TROLL antifouling restrictor also minimizes buildup and helps maintain measurement accuracy.

In-Situ’s TurbiTech Suspended Solids and Turbidity Sensors for monitoring the wastewater treatment process contain an integrated self-cleaning mechanism to keep the sensor’s optical surfaces free of fouling that could interfere with readings. Connecting the TurbiTech to a 7300 Monitor allows operators to set the desired frequency for the automatic cleaning. When initiated, two scrapers will push grease and grime off the optics as they retract back into the device, leaving the sensor faces clear to take accurate readings. The process takes only 90 seconds, leaving the sensor available more than 99 percent of the time within a six-hour cleaning cycle. This eliminates the need for expensive air-blast cleaning systems and reduces the need for operator maintenance on the sensor.
Which turbidity sensor is right for your application?
Environmental
 Aqua TROLL Turbidity Sensor$1,220.00Pricing only valid in the U.S.
Use with the Aqua TROLL 500, 600, 700 and 800 multiparameter instruments to measure turbidity.
Process
 TurbiTech Suspended Solids & Turbidity Sensors$0.00Pricing only valid in the U.S.The TurbiTech Sensors have been specifically designed for use in wastewater treatment systems where high levels of suspended solids are desirable in the aeration phase.
 TurbiTech D-ISO Turbidity Sensor$1,995.00Pricing only valid in the U.S.An automatic self-cleaning, low-range turbidity sensor designed to monitor final treated, potable and filter water.
 SoliTech IR Sensors$400.00Pricing only valid in the U.S.The SoliTech infrared sensors measure total suspended solids, sludge density and turbidity by producing an infrared signal that is reduced by the thickness of the sludge.
More Resources
The resources linked below offer guidance on common turbidity monitoring questions and challenges, provide more information on In-Situ’s technology and showcase how our customers use turbidity measurements in a variety of applications.
- Webinar Using Turbidity as a Surrogate for Estimating Suspended Sediment Concentration and Discharge
- Webinar Understanding Suspended Sediments, Solids, and Turbidity
- Webinar Paradigm Shifts in Water Quality Sensor Design
- News A Perspective on Sonde Deployment, Part 1
- News Turbidity - How We Did Away with LED Drift
- News A Perspective on Deploying Sondes, Part 2
- News ISO 7027 update and self-compensating turbidity sensor design are good news for data aficionados
- News A Perspective on Deploying Sondes, Part 3