Topics Covered
- What is chlorophyll?
- What are the units of measurement for chlorophyll?
- What affects chlorophyll in water?
- Why measure chlorophyll?
- What methods are used to measure chlorophyll?
- How do In-Situ sensors measure chlorophyll?
- What are common challenges when monitoring chlorophyll?
- What makes In-Situ chlorophyll sensors unique?
- Which chlorophyll sensor is right for your application?
- Recursos Adicionales
What is chlorophyll?
Chlorophyll is a pigment found in plants, algae and cyanobacteria, and is responsible for most of the green we enjoy in nature. It is foundational to the process of photosynthesis, whereby plants use the sun’s energy to rearrange the atoms of carbon dioxide and water into oxygen and the six-carbon sugar, glucose. This energy is then stored in the bonds of glucose, giving the plant, and any organisms who consume it, access to that energy.
In aquatic ecosystems, chlorophyll is primarily contained within phytoplankton, which are microscopic algae that drift in the water column. Comprising diatoms, dinoflagellates, green algae and cyanobacteria, phytoplankton are responsible for approximately half of the world’s oxygen production and are commonly referred to as primary producers for the foundational role they play in most aquatic food webs.
Several types of chlorophyll exist in nature, each with slightly different chemical structures and light absorption properties. Chlorophyll a, the most abundant form, is found in all photosynthetic organisms. It absorbs light primarily at wavelengths around 430 nanometers (blue) and 663 nanometers (red). Chlorophyll b, found in higher plants and green algae, has peak absorption at 453 nanometers and 642 nanometers. Other forms, including chlorophyll c and chlorophyll d, occur in specific groups of algae and contribute to the diversity of photosynthetic organisms in aquatic environments.

In all cases, the chlorophyll molecule consists of a complex ring structure called a porphyrin ring, with a magnesium atom at its center. The arrangement of the atoms in chlorophyll allows it to absorb light most efficiently in the blue and red portions of the electromagnetic spectrum, reflecting green light. This is why chlorophyll-containing organisms appear green to our eyes.
While chlorophyll converts some absorbed light into the chemical bonds of glucose, not all light absorbed by chlorophyll goes through this process and the conversion is not very efficient. Much of the energy generated during this process dissipates as heat or is released as different wavelengths of light. By definition, then, chlorophyll is a fluorescent molecule, which influences how chlorophyll is measured in water.
As the most abundant form of chlorophyll, chlorophyll a is often referred to simply as “chlorophyll.” Where we say chlorophyll on this page, you can assume we are referring to chlorophyll a.

What are the units of measurement for chlorophyll?
When following standard methods of spectrophotometry or fluorometry (See “What methods are used to measure chlorophyll?”), chlorophyll concentrations are typically reported in micrograms per liter (µg/L). Drinking water and wastewater treatment plants may also use parts per billion (ppb), which approximates µg/L.
Fluorescence measurements taken from water samples that have not undergone any extraction with solvents can also be reported in RFU, relative fluorescence units. It is strongly advised that RFU be used when monitoring chlorophyll in any natural water body. See “What are common challenges when monitoring chlorophyll?” for more context on when to use RFU versus µg/L for environmental sensors.
What affects chlorophyll in water?
Chlorophyll in water is in a constant state of change. As mentioned above in “What is chlorophyll?,” chlorophyll is an indicator of phytoplankton. Thus anything that can affect photosynthetic processes can also affect measurements of chlorophyll.
Because of its relationship to photosynthesis, chlorophyll concentrations in water bodies often follow seasonal patterns driven by temperature, light availability and nutrient dynamics. In the warmer months, increased solar radiation and longer daylight hours enhance photosynthesis and phytoplankton productivity. During this time, stratification can also trap nutrients in the surface layer, further supporting phytoplankton growth. These conditions typically lead to elevated chlorophyll levels in late spring through early fall, although timing and concentrations vary by region and water body type.
Thermal stratification also plays a role in chlorophyll distribution, especially for deeper lakes. As the water column separates into distinct thermal layers, mixing between surface and deeper layers is reduced, influencing nutrient availability and light penetration. This can lead to pronounced vertical gradients in chlorophyll, with concentrations peaking in thermoclines where both light and nutrient availability reach appropriate levels. Stratification also contributes to variability in chlorophyll levels across a water body, especially in large lakes.
Variations in phytoplankton pigment composition and cellular arrangements can also affect chlorophyll measurements. Structural differences between phytoplankton species can affect how light is absorbed and scattered in the water column, potentially complicating chlorophyll estimation. Cyanobacteria or dinoflagellates, for example, may contain accessory pigments or produce dense colonies and chains, influencing both chlorophyll concentration and its detectability by optical sensors. Understanding species composition is therefore essential for interpreting chlorophyll data accurately.
Diurnal patterns also affect chlorophyll in water. Many phytoplankton migrate vertically in the water column throughout the day. They often move towards the surface in the earlier sunlight hours before sinking to lower strata towards evening into night, creating recognizable changes in chlorophyll measurements. Phytoplankton can also alter the chlorophyll content within their individual cells in response to light availability. This process creates a smaller effect, which at times may be indiscernible from other cycles influencing chlorophyll levels. Finally, daily heating and cooling cycles affect water column mixing, which can redistribute phytoplankton and create temporal variations at specific depths. These diurnal patterns will be more apparent when measuring at a fixed depth than when taking profiling readings.
This wide variety of factors affecting chlorophyll measurements make individual data points an unreliable basis for assessing chlorophyll levels and ecological conditions. However, looking for trends in chlorophyll RFU over time accounts for the fluctuations affecting chlorophyll concentrations in water and can serve as a reliable indicator of an increasing or decreasing algal population.

Why measure chlorophyll?
As a pigment found in algae, monitoring chlorophyll is primarily to track the growth cycles of algal blooms–especially harmful algal blooms or HABs. Monitoring chlorophyll can signal healthy productivity; biomass increases naturally as a normal part of seasonal changes. But increased biomass could also indicate excessive algae growth. High chlorophyll concentrations point to eutrophication, a process where excessive nutrients (especially nitrogen and phosphorus) have polluted the water. Those nutrients would normally not be abundant enough for algae to grow to high levels. When eutrophication is present, algae can “bloom.”
Some algae produce toxins that are harmful to animals (including humans). When detected, it’s important to limit access to waters with toxic algae to protect public health, including closing recreational water bodies and adjusting drinking water treatment processes to ensure safe finished water. Monitoring and treating for HABs is also important for environmental health.
Surface Water
As mentioned above, chlorophyll is an indicator of algal biomass and as such can be used as a proxy for phytoplankton abundance. Early detection of harmful algal blooms (HABs) is one of the main ways chlorophyll data proves useful. While not a direct measure of toxicity, chlorophyll is a valuable screening tool that can trigger targeted sampling and mitigation before blooms escalate.
If blooms reach unsustainable levels, algae will die and be consumed by microbes in the water, called heterotrophs. When heterotrophs consume algae, they deplete water bodies of the dissolved oxygen that sustains aquatic life. If this process progresses, it can create hypoxic conditions and lead to fish kills. Monitoring chlorophyll is one strategy for tracking and controlling eutrophication and can help prevent fish kills, protecting environmental health and recreational water quality.
Algal biomass is generally important in a much broader context as well. Monitoring algal biomass in surface water bodies contributes to our understanding of aquatic food webs and ecological productivity and seasonal variability in algal dynamics. It can also help identify if shifts in ecosystem health are due to natural or human influences.
Tracking chlorophyll trends over time can illuminate nutrient pollution sources, and assess the influence of upstream land use and the effectiveness of restoration projects. Long-term chlorophyll data can inform policies aimed at improving or maintaining water quality, and help evaluate and inform sustainable watershed management practices. Because of this, chlorophyll is often included in environmental reporting regulations as a required parameter.

Drinking Water
As a key indicator of algal activity, chlorophyll data is essential for source water monitoring. Algal blooms in drinking water lakes and reservoirs complicate the drinking water treatment process. Increased algal biomass can cause operational issues (such as clogged filters) and demand higher doses of chemicals throughout the process. Tracking chlorophyll concentrations allows operators to detect algal blooms early and proactively adjust treatment strategies to maintain compliance, optimize chemical dosing for cost efficiency and reduce disruptions to the process.
Many algal toxins produce unpleasant tastes and smells that persist even at safe concentrations. Chlorophyll monitoring can help predict when these issues may arise, allowing for proactive use of activated carbon or other treatment modifications to maintain customer satisfaction. Continuous chlorophyll monitoring enables predictive planning for seasonal variations in water quality, allowing operators to anticipate concerns and address them early.

What methods are used to measure chlorophyll?
Spectrophotometers
The most widely used method for measuring chlorophyll involves extracting it from samples using solvents like acetone or ethanol. After extraction, the chlorophyll concentration is determined using a spectrophotometer that measures light absorption at specific wavelengths (e.g., 665 nm is often used for chlorophyll a).
ISO 10260:1992 provides the international standard for spectrophotometric measurement of chlorophyll, and it outlines sample collection, extraction and analysis. The USEPA has developed several complementary methods for chlorophyll analysis. Methods 445.0 and 446.0 describe approaches to extracting and measuring chlorophyll from marine and freshwater algae samples, and these methods are considered by many to be the gold standard for chlorophyll analysis of aquatic samples.

Fluorometers
Fluorescence offers a more sensitive alternative to spectrophotometry. Fluorescent molecules like chlorophyll absorb light, which excites electrons in the molecule. The energy those electrons hold must either be passed on to another molecule or released as heat or light. During photosynthesis there are a number of accessory pigments and electron carriers that receive those electrons from chlorophyll. But it’s not a perfectly efficient handoff–some of that energy is lost as heat and some is lost as light. Fluorometers detect this emission of light.
As with all fluorescent molecules, chlorophyll emits longer wavelengths of light (at a lower energy) than the light it absorbs. Fluorometers are designed to detect the specific wavelengths of light that chlorophyll emits. Fluorometers can directly detect this light in a water sample without the extraction process a spectrophotometer requires. This makes the fluorometric method faster and reduces the volume of sample required to assess chlorophyll concentrations.
However, the sensitivity of this method makes it prone to interferences. Other fluorescent molecules in the water may emit similar wavelengths of light, so fluorometric methods require the use of LEDs, filters and other strategies to isolate and identify chlorophyll-specific light emissions. Design features that limit emission interference are critical for reliable measurement of chlorophyll in the environment.
Submersible Sensors and Probes
Advanced water quality monitoring systems now incorporate chlorophyll sensors that can measure relative concentrations continuously without discrete sample collection. These sensors use fluorescence-based technology to provide real-time data on chlorophyll levels, often as part of multiparameter monitoring platforms such as In-Situ’s Aqua TROLL sondes.
Sensors are particularly valuable for long-term monitoring programs, early warning systems and studies requiring high-temporal-resolution data. They can detect rapid changes in chlorophyll concentrations that might be missed by grab sampling.
Because of the biological variance in chlorophyll fluorescence, the relationship between relative fluorescence and other derived parameters like cell count or concentration varies highly for each deployment site. The correlation of Relative Fluorescence Units (RFU) to concentration or cell count needs to be determined empirically through laboratory analysis of grab samples. Researchers should use portable sensors in conjunction with sample collection and extractive analyses to better understand correlations between sensor measurements and laboratory measurements. For most purposes, however, the benefits of continuous chlorophyll measurements outweigh any tradeoffs in accuracy.

How do In-Situ sensors measure chlorophyll?
In-Situ chlorophyll sensors are specialized fluorometers–optical instruments that measure fluorescence in a target substance in water. Many molecules have the ability to absorb light from a specific spectrum and then emit light at a different wavelength, a process known as fluorescence.
These fluorescent molecules can be detected using a carefully designed system: an LED emitter generates light at a specific wavelength, while filters isolate the desired excitation spectrum. When this light reaches fluorescent molecules in a water sample, they absorb the energy and subsequently emit light at a longer wavelength (lower energy). This emitted light constitutes the fluorescence signature.
The sensor’s detector, equipped with its own set of filters, captures this emitted light and measures its intensity. Since the intensity of fluorescence is proportional to the concentration of fluorescent molecules, the sensor can effectively estimate the concentration of target substances in the water. As concentration increases, more molecules are exposed to the excitation light, typically resulting in stronger fluorescence.
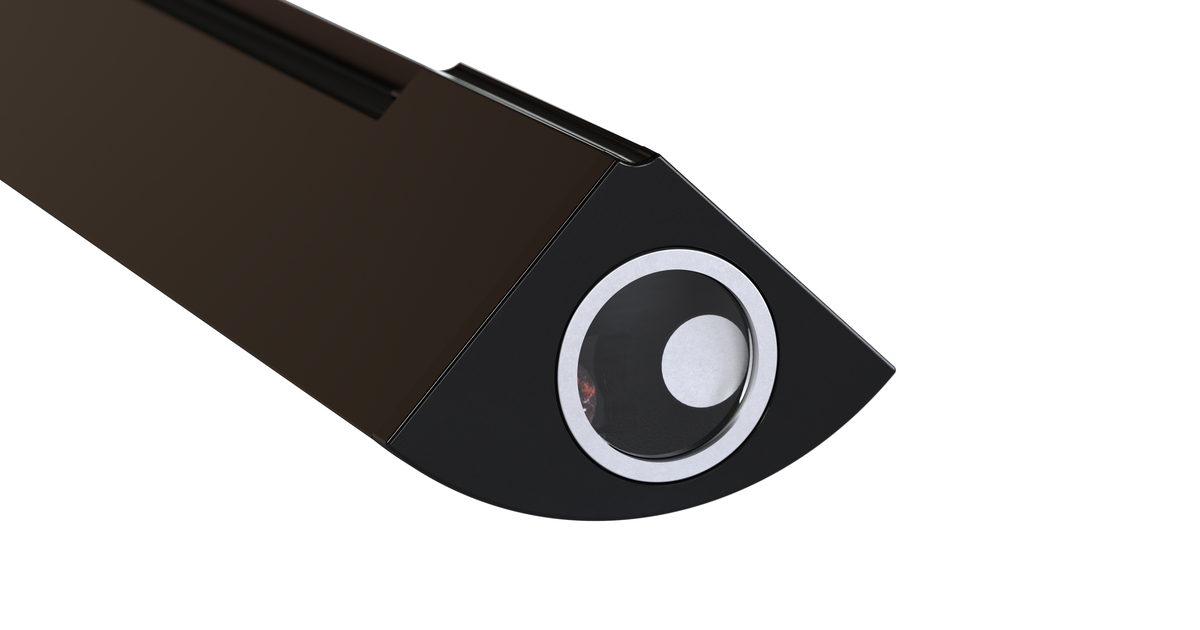
In-Situ’s chlorophyll sensor is a submersible fluorometer with an LED that emits 430 nm light to excite chlorophyll molecules in the water. The sensor includes a filter that enables 675-750 nm light wavelengths to reach a detector. This wavelength range encompasses the light that chlorophyll emits as fluorescence.
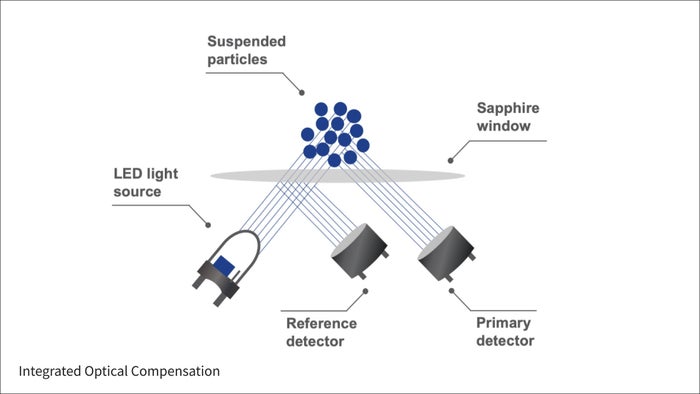
In-Situ fluorometers also contain a reference detector for Integrated Optical Compensation. The reference detector measures any changes in LED brightness and automatically compensates each reading for differences caused by temperature or age of the sensor.
Chlorophyll measurements are typically expressed in Relative Fluorescence Units (RFUs). RFUs will give relative changes in concentration of the fluorescent substance but will not provide an exact concentration. The instrument can derive an estimate for cell count (default cells/mL) and concentration (default μg/L) based on a linear correlation with the relative fluorescence measured by the sensor. You can enable derived parameters and enter a linear scale factor for your deployment site in the VuSitu mobile app.

What are common challenges when monitoring chlorophyll?
Most of the challenges of monitoring chlorophyll are universal for optical or fluorescence measurements in water. However, while some fluorescent parameters are strictly physical or chemical, chlorophyll is a biological parameter. This creates unique challenges for chlorophyll monitoring, which are covered in the last entry of this section, “Correlational Accuracy.”
Fouling
The most notorious challenge when monitoring chlorophyll in the field is fouling. When buildup obstructs the sensor window, the sensor cannot deliver or receive light. This process is essential to sensor functionality; any accumulation that blocks the sensor window will therefore interfere with chlorophyll measurements. A regular maintenance and passive and mechanical antifouling tools are essential for reliable data collection with optical sensors.

Temperature
For all fluorometers, there is an inverse relationship between fluorescence and temperature. This presents the greatest challenge at very low ranges of sensor detection. At these ranges, a change from 0.1 to 0.2 RFU, for instance, may look like an increase in fluorescence, when it may actually represent a decrease in temperature while measuring in deeper waters or a temperature drop due to seasonal change. On-board temperature sensors can help with understanding the influence of temperature on chlorophyll measurements and enable temperature corrections. The importance and level of temperature’s effect on fluorescence is project specific and any corrections should be developed empirically on a project-by-project basis.

Turbidity
All optical sensors experience interference from turbidity. Storm events, high sediment loads, and different types of water bodies can all increase turbidity and its effects on chlorophyll monitoring. High turbidity increases the chances that the wavelengths of light will not have a clear path to and from the sensor. Particulates in water can block the light that reaches fluorescent molecules and light emitted by the fluorescent molecules can similarly be blocked from reaching the sensor.
Best practice is to always measure turbidity alongside chlorophyll. At the very least, this enables an awareness of possible turbidity interference. In some cases, turbidity measurements can help develop a mathematical correction for turbidity interference. The threshold at which turbidity interference occurs, in either nephelometric turbidity units (NTUs) or formazin nephelometric units (FNU), depends on both the monitoring site and project objectives. Any turbidity corrections must be developed empirically from site-specific measurements.

Inner Filter Effects
The inner filter effect is a type of interference gaining interest in environmental monitoring. “Inner” refers to a light-filtering effect created by compounds contained within a sample. For example, if there is a very high concentration of chlorophyll, molecules may absorb some of the excitation light, reducing the amount of light that reaches molecules deeper in the sample. Emitted fluorescence might also be absorbed by other fluorescent molecules in the water. Both of these processes lead to a non-linear response and an underestimation of chlorophyll.
Another response to this challenge is to collect samples and dilute them, to see if there is a linear response with chlorophyll and concentration of the sample. As with temperature and turbidity, the objectives of the monitoring program must drive the decision of whether and how to address these interferences.

Correlational Accuracy
The factors that affect chlorophyll in water also affect the relationship between chlorophyll concentration and algal biomass. RFU measured in winter might correlate with a different overall biomass concentration than the same RFU measured in summer. This is why a sensor cannot actually measure µg/L or ppb directly in the environment.
A sensor provides an RFU value based on units that have been built into the sensor’s algorithm. This algorithm is developed based on correlations between extractive methods used in a laboratory (either spectrophotometry or fluorometry) and measurements of chlorophyll pigment in water. For these reasons, In-Situ strongly recommends looking for trends and changes when monitoring for chlorophyll, as opposed to basing chlorophyll concentrations on spot-check measurements or short-term datasets.
Users can build their own correlations, taking extractive spectrophotometric measurements from field locations where portable chlorophyll sensors are deployed. This is an excellent practice, and often a necessary one for regulatory reporting (especially where µg/L is a required unit, for example), but it has limitations. A sensor in water sees chlorophyll that is free floating, as well as chlorophyll that is attached to both living and dead cells. Extractive methods used to build correlations cannot capture all chlorophyll forms. It is important to consider these discrepancies when building correlations and interpret correlations carefully.
It is generally regarded as best practice not to replace extractive methods with portable chlorophyll sensors, especially for research purposes that require highly accurate measurements. However, portable chlorophyll sensors are extremely helpful for capturing and responding to real-time changes in water quality and understanding long-term trends. They enable high-resolution data collection at relatively low cost, delivering much larger datasets for a fraction of the time and resources required by grab sample collection and laboratory analysis.

What makes In-Situ chlorophyll sensors unique?
Integrated Optical Compensation
Optical sensor LED brightness will decrease with prolonged use like with any equipment. In-Situ chlorophyll sensors include a primary detector and secondary reference detector to measure LED drift and automatically compensate each reading. This provides stability at much lower limits of detection and significantly reduces sensor drift over temperature and time.
Isolated Optical Frequencies
In most water quality platforms, installing more than one optical sensor causes interference among sensors. Each In-Situ optical sensor runs at a unique frequency that creates a digital signature for each light source. Detectors for chlorophyll sensors use this signature to isolate chlorophyll wavelengths from other light sources and measure only the targeted parameter. This allows multiple optical sensors to run simultaneously in one instrument.

Ambient Light Rejection
Environments with ambient light can pose challenges for optical measurement methods if sensors can’t distinguish between external and internal light sources. In-Situ chlorophyll sensors separate light from the sensor from other ambient light sources, enabling the same degree of accuracy regardless of lighting conditions or deployment location.

Low-Interference Spectral Bands
Interferences between sensors and inaccuracies in algae monitoring data are more likely to occur when fluorometers excite a wider range of wavelengths. In-Situ fluorometers include one parameter per sensor. Each sensor excites a small range of the light spectrum to increase accuracy while minimizing interference from other fluorescence sources.

Which Chlorophyll a sensor is right for your application?
 Aqua TROLL Chlorophyll a Sensor1.995,00 US$Precios sólo válidos en Reino Unido.
Úselo con las multiples sondas Aqua TROLL 500 y 600 para medir la clorofila.
 Aqua TROLL 500 Multiparameter Sonde0,00 US$Precios sólo válidos en Reino Unido.Una sonda multiparamétrica de cinco puertos totalmente adaptable con capacidad para cuatro sensores intercambiables y un limpiador de antifouling. Una interfaz para teléfono móvil ofrece datos precisos y permite una calibración simplificada, una vista panorámica de datos y la creación de informes. Perfecta para aplicaciones de verificación de puntos y creación de perfiles cuando se usa con un Wireless TROLL Com o para supervisión a largo plazo con telemetría VuLink.
 Aqua TROLL 600 Multiparameter Sonde4.295,00 US$Precios sólo válidos en Reino Unido.
Una sonda multiparamétrica de cinco puertos totalmente adaptable con capacidad para cuatro sensores intercambiables y un limpiador de antifouling. Cuenta con batería de larga duración y una interfaz de teléfono móvil que ofrece datos precisos y permite una calibración simplificada, vista panorámica de datos y creación de informes. Perfecta para implementaciones a corto y largo plazo. Disponible en opciones con venteo y sin venteo.
 Aqua TROLL 700 Multiparameter Sonde4.220,00 US$Precios sólo válidos en Reino Unido.Una sonda multiparamétrica de siete puertos totalmente adaptable con capacidad para seis sensores intercambiables y un limpiador antifouling. Una interfaz para teléfono móvil que ofrece datos precisos y permite una calibración simplificada, una vista panorámica de datos y la creación de informes. Perfecta para aplicaciones de verificación puntual y creación de perfiles cuando se usa con un TROLL Com inalámbrico o supervisión a largo plazo con VuLink.
 Aqua TROLL 800 Multiparameter Sonde6.330,00 US$Precios sólo válidos en Reino Unido.Una sonda multiparamétrica de siete puertos totalmente adaptable con capacidad para seis sensores intercambiables y un limpiador antifouling. Una interfaz para teléfono móvil ofrece datos precisos y permite una calibración simplificada, una vista panorámica de datos y la creación de informes. Perfecta para implementaciones a corto y largo plazo. Disponible en opciones con venteo y sin venteo.
- Seminario web Solutions for Effective Harmful Algal Bloom Monitoring: Instrumentation, Methods and Best Practices
- Seminario web Making Sense of Your Harmful Algal Bloom Data
- Seminario web Top 3 Reasons to Switch to Long-Term Harmful Algal Bloom Monitoring
- Noticias The Role of Sensor Design in Delivering Data Quality
- Noticias Top Five Items for an Algae-Monitoring Cleaning Kit
- Noticias New Patented Fluorometer Technology Improves Detection of Harmful Algal Blooms and Tracer Studies
- Noticias I SEE ALGAE EVERYWHERE
- Noticias In-Situ Brings Patented Tech to New Fluorometers — Interview with Product Manager Steve Sewell
- Noticias Adding Sensors to the "Big 5" Can Tell the Whole Story