Data Reveals Ties Between Rainfall and Groundwater Levels in a Village Well
By Peter Dumble
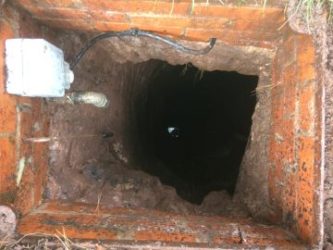
figure 1: View into well
I have been monitoring groundwater levels from a well in the village where I live in Devon, England, since January 2014. In the last year I’ve become aware of a hydrologist in the village who has been collecting daily rainfall records since 1980.
His data provides a wonderful resource for comparison to groundwater, so it’s a good time to reflect a little on the trends over the last five years and how they relate to rainfall records collected less than 1 km away.
Groundwater level data from the village well
The well itself is up to 1.5 meters in diameter and 12.5 meters deep. It is excavated into a brecciated and well-cemented part of the area’s Triassic sandstones (see earlier blog – https://in-situ.com/blog/purge-volumes-in-groundwater-sampling-part-2).
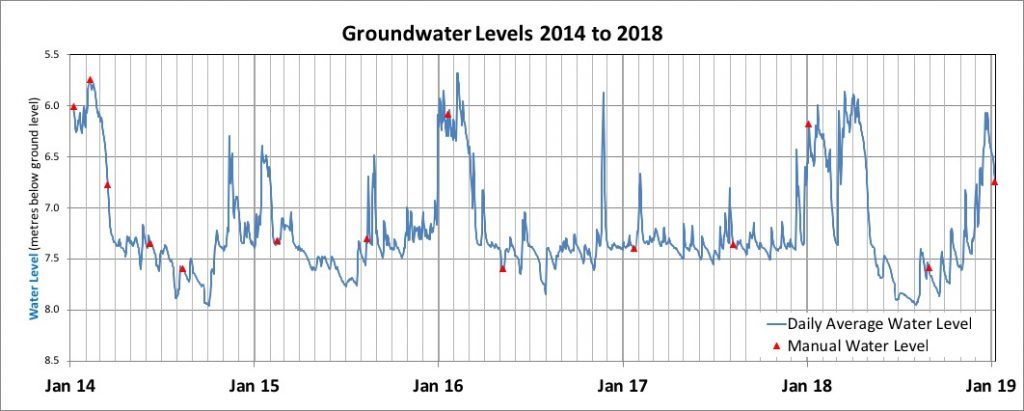
Figure 2 presents daily average groundwater levels derived from the logger data for the last five years. Measurements are recorded every 15 minutes using an In-Situ Rugged Troll pressure logger. Manual water levels measured each time the loggers were downloaded and re-programmed are also plotted onto Figure 2.
There are no two years alike, although the maximum-to-minimum range in level each year is consistently between 2 and 2.5 meters.
Thirty-Eight Years of Daily Rainfall Records!
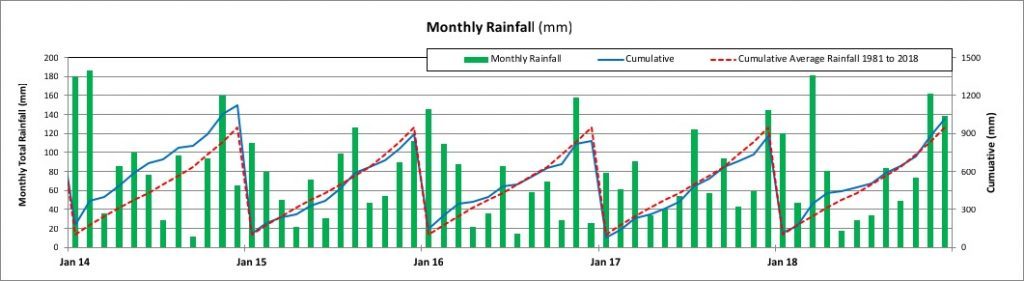
The hydrologist who’s been collecting local, daily rainfall records for 38 years offers some interesting comparative data. (Figures 3 and 4).
Four of the last five years have produced annual rainfall totals close to the 38-year average of 947 mm. The outlier, 2014, produced an annual rainfall of 1,121 mm (Figure 3). January and February 2014 were exceptionally wet, resulting in widespread flooding in the area.
Comparing Rainfall to Groundwater Levels
The correlation between daily rainfall and changes in groundwater levels during 2018, is quite remarkable (Figure 4).
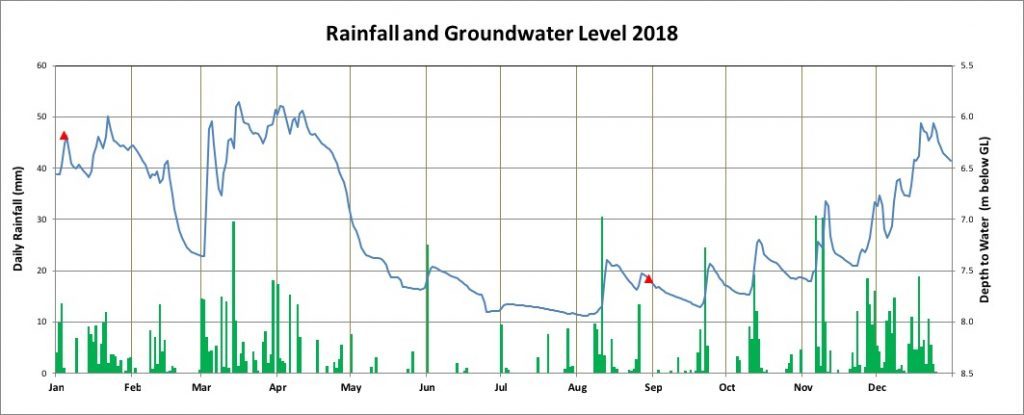
Groundwater level in the well rose rapidly following high-intensity rainfall events. It remained elevated during periods of sustained rainfall (March to early April for example) and gradually recessed during an unusually long dry spell from mid-April to mid-August. From mid-August to mid-November, there were several high-intensity rainfall events that resulted in a series of cyclical 0.5 meter rises and falls in water level. The max-to-min range in groundwater level over the year was around 2 meters, in line with previous years (Figure 2).
Linking daily rainfall events so reliably to groundwater level fluctuations is not always so easy or obvious. There’s something interesting causing this rapid recharge – perhaps something to consider for another blog in the future. In the meantime, it’s certainly worthwhile to keep the duel monitoring going.
©Peter.Dumble@pdhydrogeology.com